Question
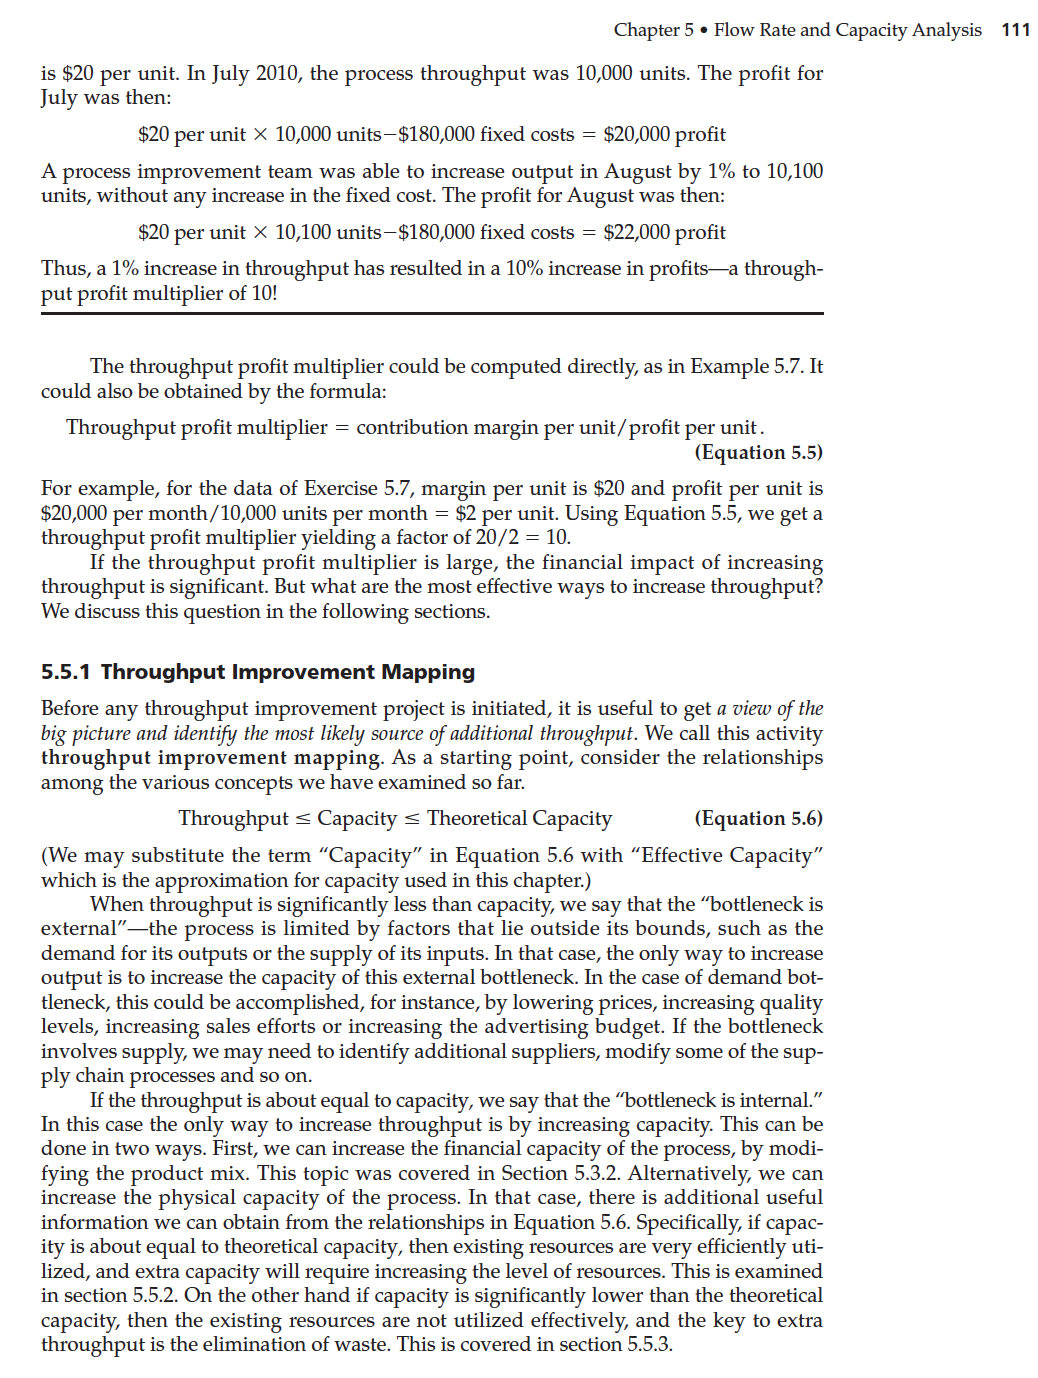
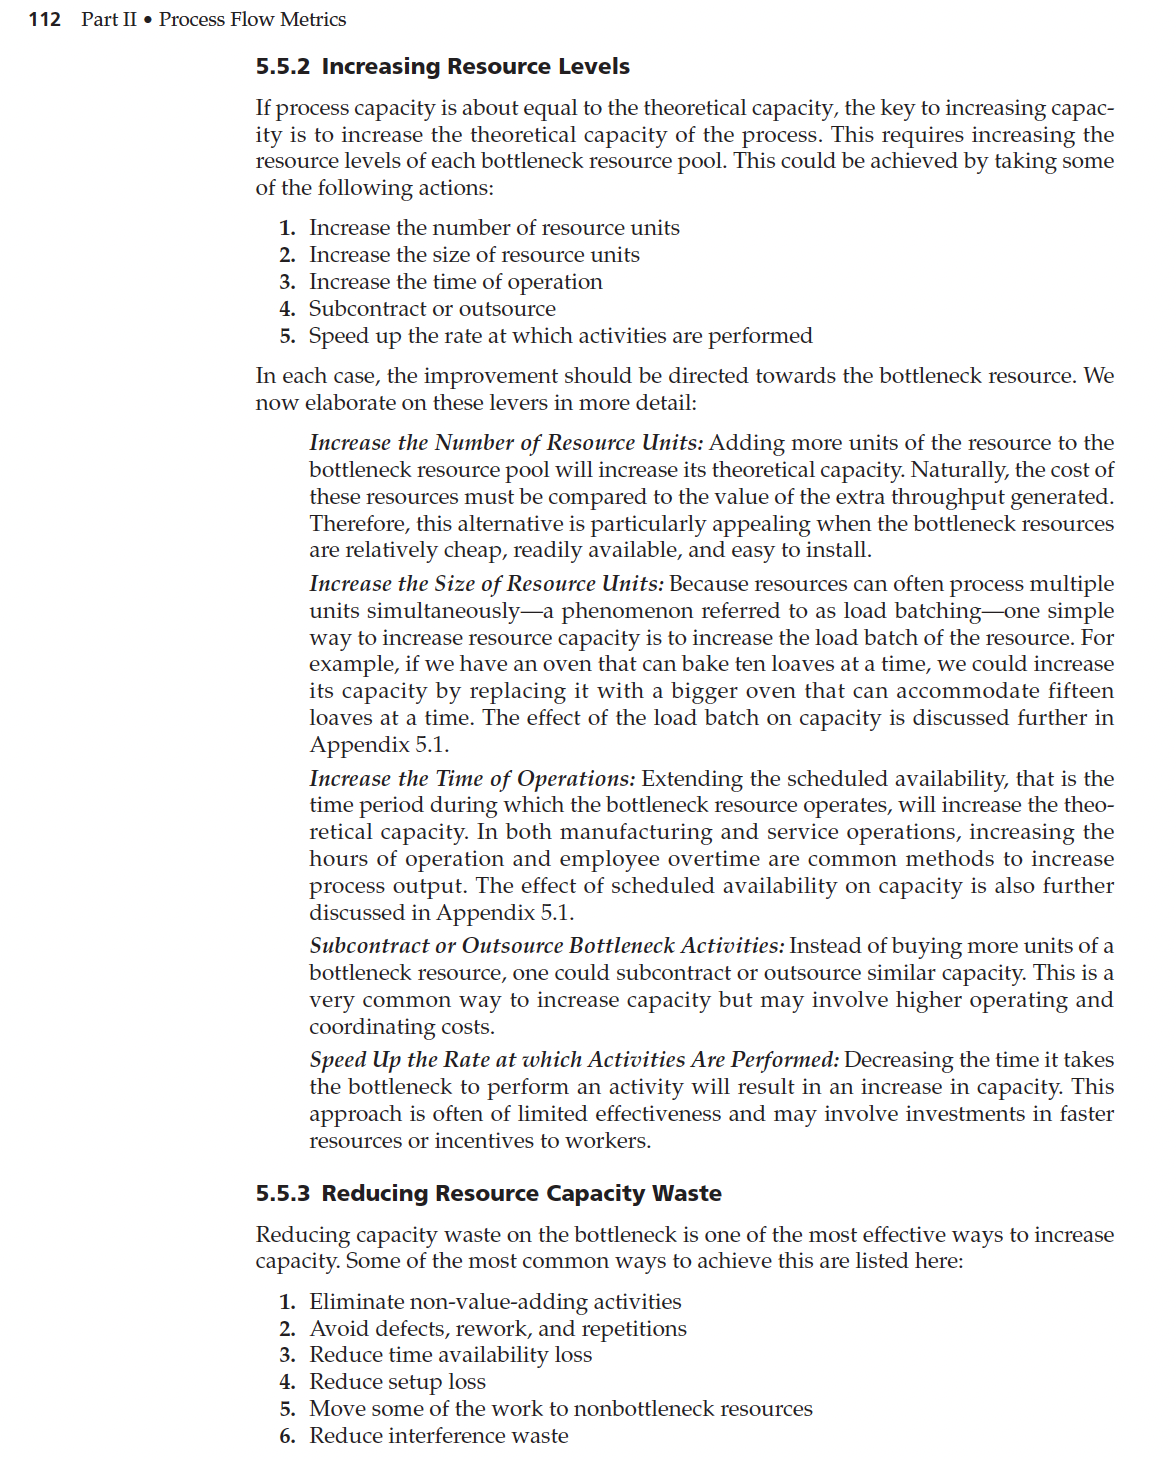
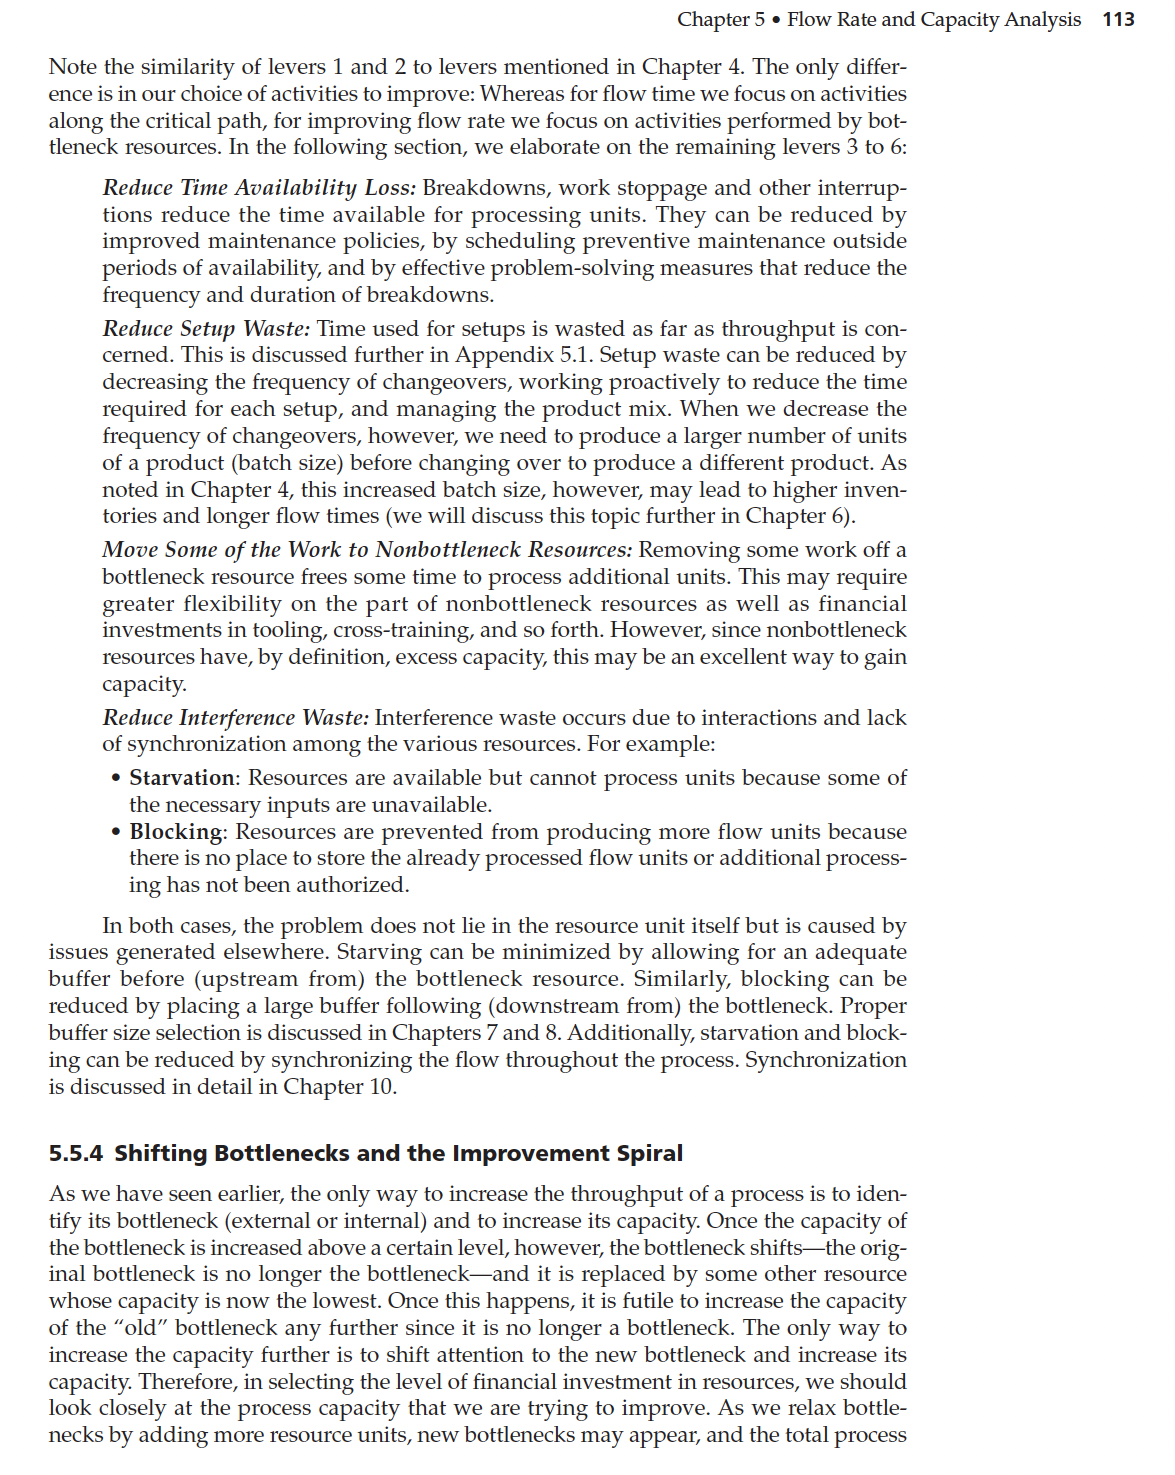
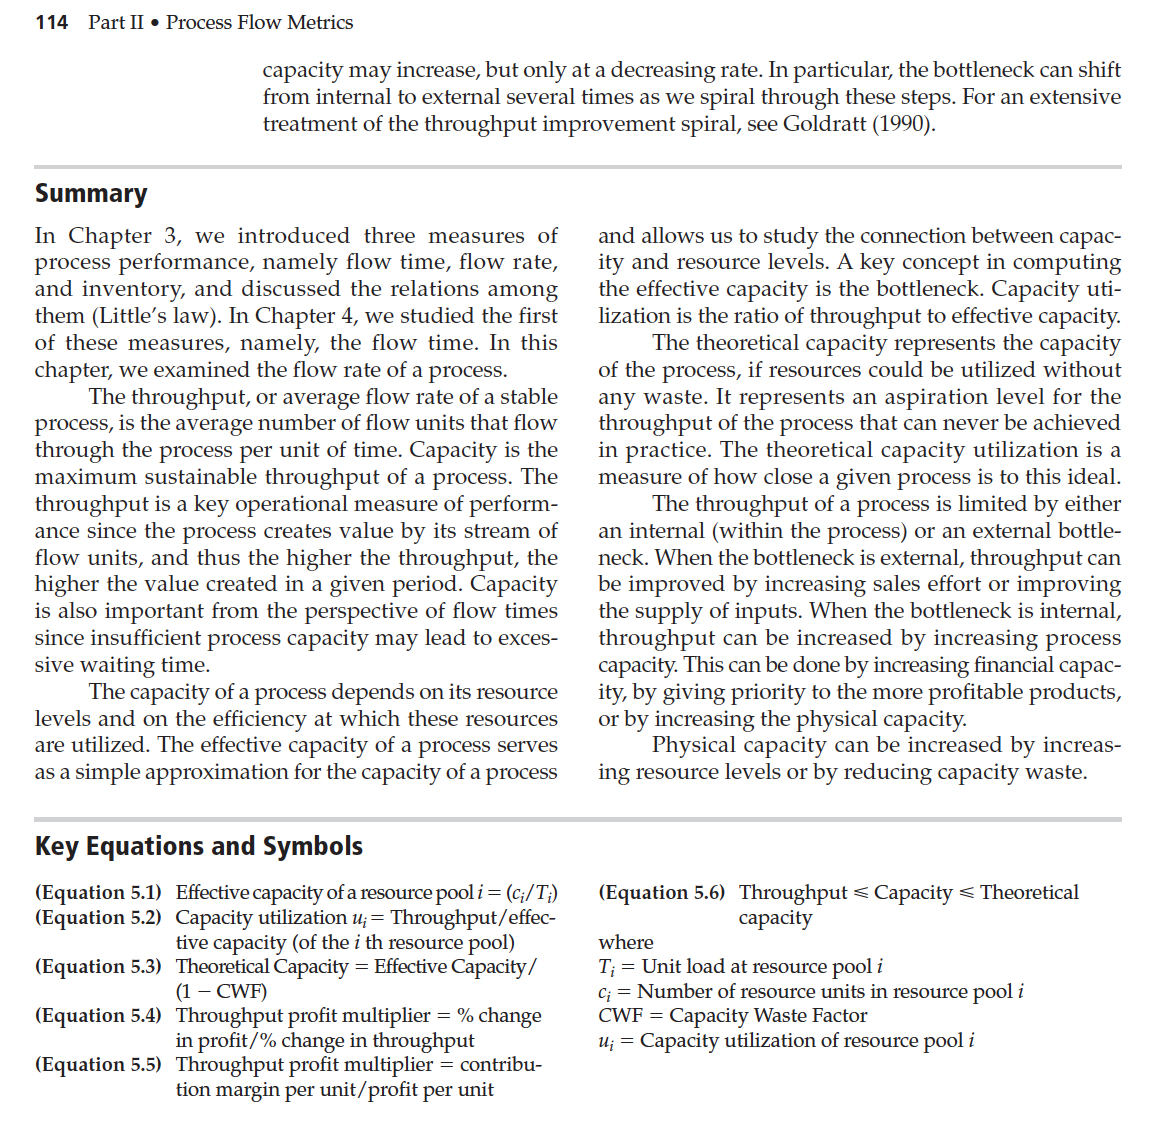
1) Please thoroughly study/review pages 111 to 114 from the textbook for this group report. Each student is expected to bring one example from real-life
1) Please thoroughly study/review pages 111 to 114 from the textbook for this group report. Each student is expected to bring one example from real-life and/or past workplaces or your own observations of a situation or a process, which you find to be similar to one of the cases described on pages 112-113 and which could be improved, or was improved through one of the proposed solutions on those pages, as per your observations.
2) Each student must document his/her/their example in 1-2 pages max (and then the group must work together to prepare a group report with proper formatting). For each example, please describe the process at a high level (and/or in more detail if available), and then articulate the situation that needed improvement. Afterward, explain which one of the cases from those noted on pages 112-113 could be applicable to that process in that situation and could have made a difference toward improving that process/situation. If you observed and/or participated in some improvement activities for that process/situation as well, please describe what activities or solutions were applied, and mention the case from pages 112-113 to which your observed improvement was relevant.
In summary:
Each group is needed to submit one written report which must include 1 example provided by each student in your group. Each example must describe certain things, and must follow a structure that explains and covers the following aspects:
1) What is the situation or your observed scenario/process (describe it at a high level but provide more details such as process metrics, observed issues, challenges, etc.)
2) Which of the cases from pages 112-113 applies or was applicable to enable some improvements in that scenario/example that you have provided? Explain how applying that solution (from pages 112-113) improved, could improve, or could have improved that process, and provide your observation and high-level analysis. Here is an example from a past report submitted by the students:
Example: "I am an international student and work at Tim Hortons. A year ago, the restaurant was only serving through the skip-the-dishes and/or directly to the customers, and it was not getting much income. Accordingly, this was an issue of External bottlenecks, which means that while the staff had the capacity to serve more people, there was not enough demand coming their way. After a while, Tim Hortons started accepting orders from Uber eats and Doordash delivery, as a result of which, the restaurant is getting higher profits which also helps maintain the market position and address the issue of external bottlenecks (NOTE: if you have some ballpark numbers to add here, it will be great to give the audience a sense of how much improvement was obtained in throughput as a result). However, a downside of these increased delivery channels was an increased wait time for the customers and an increased burden on employees as they needed to do more hard work (and obviously this caused an internal bottleneck to emerge). Tim Hortons could address this issue through the following actions, which is an example of spiral improvements and shifting the bottlenecks as per what is described on page 113:
- Increase the number of resources
- Look for ways to speed up the processes
- Provide incentives to encourage happy hours and outside the peak hours ordering to level the capacity and move work off the bottlenecks.


Chapter \\( 5 \\bullet \\) Flow Rate and Capacity Anal is \\( \\$ 20 \\) per unit. In July 2010 , the process throughput was 10,000 units. The profit for July was then: \\[ \\$ 20 \\text { per unit } \\times 10,000 \\text { units }-\\$ 180,000 \\text { fixed costs }=\\$ 20,000 \\text { profit } \\] A process improvement team was able to increase output in August by 1\\% to 10,100 units, without any increase in the fixed cost. The profit for August was then: \\[ \\$ 20 \\text { per unit } \\times 10,100 \\text { units }-\\$ 180,000 \\text { fixed costs }=\\$ 22,000 \\text { profit } \\] Thus, a \1 increase in throughput has resulted in a \10 increase in profits-a throughput profit multiplier of 10 ! The throughput profit multiplier could be computed directly, as in Example 5.7. It could also be obtained by the formula: Throughput profit multiplier \\( = \\) contribution margin per unit/profit per unit. (Equation 5.5) For example, for the data of Exercise 5.7, margin per unit is \\( \\$ 20 \\) and profit per unit is \\( \\$ 20,000 \\) per month/10,000 units per month \\( =\\$ 2 \\) per unit. Using Equation 5.5 , we get a throughput profit multiplier yielding a factor of \\( 20 / 2=10 \\). If the throughput profit multiplier is large, the financial impact of increasing throughput is significant. But what are the most effective ways to increase throughput? We discuss this question in the following sections. 5.5.1 Throughput Improvement Mapping Before any throughput improvement project is initiated, it is useful to get a view of the big picture and identify the most likely source of additional throughput. We call this activity throughput improvement mapping. As a starting point, consider the relationships among the various concepts we have examined so far. \\[ \\text { Throughput } \\leq \\text { Capacity } \\leq \\text { Theoretical Capacity } \\] (Equation 5.6) (We may substitute the term \"Capacity\" in Equation 5.6 with \"Effective Capacity\" which is the approximation for capacity used in this chapter.) When throughput is significantly less than capacity, we say that the \"bottleneck is external\" - the process is limited by factors that lie outside its bounds, such as the demand for its outputs or the supply of its inputs. In that case, the only way to increase output is to increase the capacity of this external bottleneck. In the case of demand bottleneck, this could be accomplished, for instance, by lowering prices, increasing quality levels, increasing sales efforts or increasing the advertising budget. If the bottleneck involves supply, we may need to identify additional suppliers, modify some of the supply chain processes and so on. If the throughput is about equal to capacity, we say that the \"bottleneck is internal.\" In this case the only way to increase throughput is by increasing capacity. This can be done in two ways. First, we can increase the financial capacity of the process, by modifying the product mix. This topic was covered in Section 5.3.2. Alternatively, we can increase the physical capacity of the process. In that case, there is additional useful information we can obtain from the relationships in Equation 5.6. Specifically, if capacity is about equal to theoretical capacity, then existing resources are very efficiently utilized, and extra capacity will require increasing the level of resources. This is examined in section 5.5.2. On the other hand if capacity is significantly lower than the theoretical capacity, then the existing resources are not utilized effectively, and the key to extra throughput is the elimination of waste. This is covered in section 5.5.3. 114 Part II Process Flow Metrics capacity may increase, but only at a decreasing rate. In particular, the bottleneck can shift from internal to external several times as we spiral through these steps. For an extensive treatment of the throughput improvement spiral, see Goldratt (1990). Summary In Chapter 3, we introduced three measures of process performance, namely flow time, flow rate, and inventory, and discussed the relations among them (Little's law). In Chapter 4, we studied the first of these measures, namely, the flow time. In this chapter, we examined the flow rate of a process. The throughput, or average flow rate of a stable process, is the average number of flow units that flow through the process per unit of time. Capacity is the maximum sustainable throughput of a process. The throughput is a key operational measure of performance since the process creates value by its stream of flow units, and thus the higher the throughput, the higher the value created in a given period. Capacity is also important from the perspective of flow times since insufficient process capacity may lead to excessive waiting time. The capacity of a process depends on its resource levels and on the efficiency at which these resources are utilized. The effective capacity of a process serves as a simple approximation for the capacity of a process Key Equations and Symbols (Equation 5.1) Effective capacity of a resource pool \\( i=\\left(c_{i} / T_{i}\ ight) \\) (Equation 5.2) Capacity utilization \\( u_{i}= \\) Throughput/effective capacity (of the \\( i \\) th resource pool) (Equation 5.3) Theoretical Capacity = Effective Capacity/ \\( (1-\\mathrm{CWF}) \\) (Equation 5.4) Throughput profit multiplier \= change in profit/\\% change in throughput (Equation 5.5) Throughput profit multiplier = contribution margin per unit/profit per unit and allows us to study the connection between capacity and resource levels. A key concept in computing the effective capacity is the bottleneck. Capacity utilization is the ratio of throughput to effective capacity. The theoretical capacity represents the capacity of the process, if resources could be utilized without any waste. It represents an aspiration level for the throughput of the process that can never be achieved in practice. The theoretical capacity utilization is a measure of how close a given process is to this ideal. The throughput of a process is limited by either an internal (within the process) or an external bottleneck. When the bottleneck is external, throughput can be improved by increasing sales effort or improving the supply of inputs. When the bottleneck is internal, throughput can be increased by increasing process capacity. This can be done by increasing financial capacity, by giving priority to the more profitable products, or by increasing the physical capacity. Physical capacity can be increased by increasing resource levels or by reducing capacity waste. (Equation 5.6) Throughput \\( \\leqslant \\) Capacity \\( \\leqslant \\) Theoretical capacity where \\( T_{i}= \\) Unit load at resource pool \\( i \\) \\( c_{i}= \\) Number of resource units in resource pool \\( i \\) \\( C W F= \\) Capacity Waste Factor \\( u_{i}= \\) Capacity utilization of resource pool \\( i \\) 5.5.2 Increasing Resource Levels If process capacity is about equal to the theoretical capacity, the key to increasing capacity is to increase the theoretical capacity of the process. This requires increasing the resource levels of each bottleneck resource pool. This could be achieved by taking some of the following actions: 1. Increase the number of resource units 2. Increase the size of resource units 3. Increase the time of operation 4. Subcontract or outsource 5. Speed up the rate at which activities are performed In each case, the improvement should be directed towards the bottleneck resource. We now elaborate on these levers in more detail: Increase the Number of Resource Units: Adding more units of the resource to the bottleneck resource pool will increase its theoretical capacity. Naturally, the cost of these resources must be compared to the value of the extra throughput generated. Therefore, this alternative is particularly appealing when the bottleneck resources are relatively cheap, readily available, and easy to install. Increase the Size of Resource Units: Because resources can often process multiple units simultaneously-a phenomenon referred to as load batchingone simple way to increase resource capacity is to increase the load batch of the resource. For example, if we have an oven that can bake ten loaves at a time, we could increase its capacity by replacing it with a bigger oven that can accommodate fifteen loaves at a time. The effect of the load batch on capacity is discussed further in Appendix 5.1. Increase the Time of Operations: Extending the scheduled availability, that is the time period during which the bottleneck resource operates, will increase the theoretical capacity. In both manufacturing and service operations, increasing the hours of operation and employee overtime are common methods to increase process output. The effect of scheduled availability on capacity is also further discussed in Appendix 5.1. Subcontract or Outsource Bottleneck Activities: Instead of buying more units of a bottleneck resource, one could subcontract or outsource similar capacity. This is a very common way to increase capacity but may involve higher operating and coordinating costs. Speed Up the Rate at which Activities Are Performed: Decreasing the time it takes the bottleneck to perform an activity will result in an increase in capacity. This approach is often of limited effectiveness and may involve investments in faster resources or incentives to workers. 5.5.3 Reducing Resource Capacity Waste Reducing capacity waste on the bottleneck is one of the most effective ways to increase capacity. Some of the most common ways to achieve this are listed here: 1. Eliminate non-value-adding activities 2. Avoid defects, rework, and repetitions 3. Reduce time availability loss 4. Reduce setup loss 5. Move some of the work to nonbottleneck resources 6. Reduce interference waste Chapter \\( 5 \\bullet \\) Flow Rate and Ca Note the similarity of levers 1 and 2 to levers mentioned in Chapter 4 . The only difference is in our choice of activities to improve: Whereas for flow time we focus on activities along the critical path, for improving flow rate we focus on activities performed by bottleneck resources. In the following section, we elaborate on the remaining levers 3 to 6 : Reduce Time Availability Loss: Breakdowns, work stoppage and other interruptions reduce the time available for processing units. They can be reduced by improved maintenance policies, by scheduling preventive maintenance outside periods of availability, and by effective problem-solving measures that reduce the frequency and duration of breakdowns. Reduce Setup Waste: Time used for setups is wasted as far as throughput is concerned. This is discussed further in Appendix 5.1. Setup waste can be reduced by decreasing the frequency of changeovers, working proactively to reduce the time required for each setup, and managing the product mix. When we decrease the frequency of changeovers, however, we need to produce a larger number of units of a product (batch size) before changing over to produce a different product. As noted in Chapter 4, this increased batch size, however, may lead to higher inventories and longer flow times (we will discuss this topic further in Chapter 6). Move Some of the Work to Nonbottleneck Resources: Removing some work off a bottleneck resource frees some time to process additional units. This may require greater flexibility on the part of nonbottleneck resources as well as financial investments in tooling, cross-training, and so forth. However, since nonbottleneck resources have, by definition, excess capacity, this may be an excellent way to gain capacity. Reduce Interference Waste: Interference waste occurs due to interactions and lack of synchronization among the various resources. For example: - Starvation: Resources are available but cannot process units because some of the necessary inputs are unavailable. - Blocking: Resources are prevented from producing more flow units because there is no place to store the already processed flow units or additional processing has not been authorized. In both cases, the problem does not lie in the resource unit itself but is caused by issues generated elsewhere. Starving can be minimized by allowing for an adequate buffer before (upstream from) the bottleneck resource. Similarly, blocking can be reduced by placing a large buffer following (downstream from) the bottleneck. Proper buffer size selection is discussed in Chapters 7 and 8 . Additionally, starvation and blocking can be reduced by synchronizing the flow throughout the process. Synchronization is discussed in detail in Chapter 10. 5.5.4 Shifting Bottlenecks and the Improvement Spiral As we have seen earlier, the only way to increase the throughput of a process is to identify its bottleneck (external or internal) and to increase its capacity. Once the capacity of the bottleneck is increased above a certain level, however, the bottleneck shifts-the original bottleneck is no longer the bottleneck-and it is replaced by some other resource whose capacity is now the lowest. Once this happens, it is futile to increase the capacity of the \"old\" bottleneck any further since it is no longer a bottleneck. The only way to increase the capacity further is to shift attention to the new bottleneck and increase its capacity. Therefore, in selecting the level of financial investment in resources, we should look closely at the process capacity that we are trying to improve. As we relax bottlenecks by adding more resource units, new bottlenecks may appear, and the total process
Step by Step Solution
There are 3 Steps involved in it
Step: 1

Get Instant Access to Expert-Tailored Solutions
See step-by-step solutions with expert insights and AI powered tools for academic success
Step: 2

Step: 3

Ace Your Homework with AI
Get the answers you need in no time with our AI-driven, step-by-step assistance
Get Started


