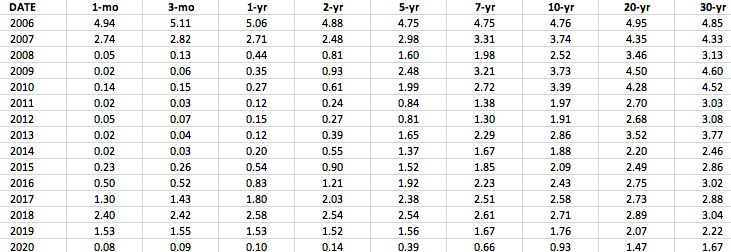
1. Plot the yield curve for each year between 2006 2020 and display these data on one graph.
2. For each year indicate the shape of the yield curve, i.e., Normal, Inverted, or Flat.
3. Calculate and plot the series of one-year forward rates for each year between 2006 2020, i.e., 2f1, 3f1, 4f1, 5f1, 6f1, 7f1, 8f1, 9f1, 10f1 must include forward rate estimates.
4. For each forward-rate curve indicate the expected direction of future short-term rates, i.e., Increasing, Decreasing, Constant.
Zero-Coupon

Yield-Curve

DATE 2006 2007 2008 2009 2010 2011 2012 2013 2014 2015 2016 2017 2018 2019 2020 1-yr 4.9231 3.1683 0.3115 0.4964 0.2483 0.0759 0.1162 0.1253 0.3842 0.7370 0.8896 1.7297 2.5447 1.6348 0.1074 2-yr 4.7957 3.1343 0.6146 1.1043 0.6349 0.2384 0.2424 0.4498 0.7874 1.1430 1.2607 1.9391 2.5638 1.6539 0.1400 3-yr 4.6903 3.2193 0.9580 1.6944 1.1180 0.4656 0.4248 0.8854 1.0887 1.4043 1.5225 2.0300 2.5317 1.6406 0.1936 4-yr 4.6210 3.3557 1.2935 2.2224 1.5969 0.7094 0.6261 1.3285 1.3327 1.5966 1.7286 2.0823 2.5016 1.6353 0.2690 5-yr 4.5874 3.5111 1.6039 2.6805 2.0350 0.9492 0.8295 1.7399 1.5432 1.7566 1.9058 2.1300 2.4917 1.6508 0.3628 6-yr 4.5840 3.6703 1.8857 3.0746 2.4235 1.1772 1.0277 2.1087 1.7328 1.9014 2.0671 2.1857 2.5057 1.6885 0.4706 7-yr 4.6042 3.8266 2.1404 3.4143 2.7648 1.3915 1.2180 2.4355 1.9082 2.0390 2.2190 2.2524 2.5412 1.7454 0.5883 8-yr 4.6421 3.9770 2.3715 3.7095 3.0651 1.5922 1.3998 2.7251 2.0732 2.1725 2.3644 2.3294 2.5940 1.8174 0.7126 9-yr 4.6928 4.1206 2.5823 3.9685 3.3308 1.7805 1.5731 2.9831 2.2300 2.3033 2.5046 2.4146 2.6600 1.9007 0.8406 10-yr 4.7526 4.2573 2.7760 4.1983 3.5679 1.9576 1.7384 3.2147 2.3797 2.4315 2.6404 2.5058 2.7356 1.9918 0.9704 DATE 2006 2007 2008 2009 2010 2011 2012 2013 2014 2015 2016 2017 2018 2019 2020 1-mo 4.94 2.74 0.05 0.02 0.14 0.02 0.05 0.02 0.02 0.23 0.50 1.30 2.40 1.53 0.08 3-mo 5.11 2.82 0.13 0.06 0.15 0.03 0.07 0.04 0.03 0.26 0.52 1.43 2.42 1.55 0.09 1-yr 5.06 2.71 0.44 0.35 0.27 0.12 0.15 0.12 0.20 0.54 0.83 1.80 2.58 1.53 0.10 2-yr 4.88 2.48 0.81 0.93 0.61 0.24 0.27 0.39 0.55 0.90 1.21 2.03 2.54 1.52 0.14 5-yr 4.75 2.98 1.60 2.48 1.99 0.84 0.81 1.65 1.37 1.52 1.92 2.38 2.54 1.56 0.39 7-yr 4.75 3.31 1.98 3.21 2.72 1.38 1.30 2.29 1.67 1.85 2.23 2.51 2.61 1.67 0.66 10-yr 4.76 3.74 2.52 3.73 3.39 1.97 1.91 2.86 1.88 2.09 2.43 2.58 2.71 1.76 0.93 20-yr 4.95 4.35 3.46 4.50 4.28 2.70 2.68 3.52 2.20 2.49 2.75 2.73 2.89 2.07 1.47 30-yr 4.85 4.33 3.13 4.60 4.52 3.03 3.08 3.77 2.46 2.86 3.02 2.88 3.04 2.22 1.67 DATE 2006 2007 2008 2009 2010 2011 2012 2013 2014 2015 2016 2017 2018 2019 2020 1-yr 4.9231 3.1683 0.3115 0.4964 0.2483 0.0759 0.1162 0.1253 0.3842 0.7370 0.8896 1.7297 2.5447 1.6348 0.1074 2-yr 4.7957 3.1343 0.6146 1.1043 0.6349 0.2384 0.2424 0.4498 0.7874 1.1430 1.2607 1.9391 2.5638 1.6539 0.1400 3-yr 4.6903 3.2193 0.9580 1.6944 1.1180 0.4656 0.4248 0.8854 1.0887 1.4043 1.5225 2.0300 2.5317 1.6406 0.1936 4-yr 4.6210 3.3557 1.2935 2.2224 1.5969 0.7094 0.6261 1.3285 1.3327 1.5966 1.7286 2.0823 2.5016 1.6353 0.2690 5-yr 4.5874 3.5111 1.6039 2.6805 2.0350 0.9492 0.8295 1.7399 1.5432 1.7566 1.9058 2.1300 2.4917 1.6508 0.3628 6-yr 4.5840 3.6703 1.8857 3.0746 2.4235 1.1772 1.0277 2.1087 1.7328 1.9014 2.0671 2.1857 2.5057 1.6885 0.4706 7-yr 4.6042 3.8266 2.1404 3.4143 2.7648 1.3915 1.2180 2.4355 1.9082 2.0390 2.2190 2.2524 2.5412 1.7454 0.5883 8-yr 4.6421 3.9770 2.3715 3.7095 3.0651 1.5922 1.3998 2.7251 2.0732 2.1725 2.3644 2.3294 2.5940 1.8174 0.7126 9-yr 4.6928 4.1206 2.5823 3.9685 3.3308 1.7805 1.5731 2.9831 2.2300 2.3033 2.5046 2.4146 2.6600 1.9007 0.8406 10-yr 4.7526 4.2573 2.7760 4.1983 3.5679 1.9576 1.7384 3.2147 2.3797 2.4315 2.6404 2.5058 2.7356 1.9918 0.9704 DATE 2006 2007 2008 2009 2010 2011 2012 2013 2014 2015 2016 2017 2018 2019 2020 1-mo 4.94 2.74 0.05 0.02 0.14 0.02 0.05 0.02 0.02 0.23 0.50 1.30 2.40 1.53 0.08 3-mo 5.11 2.82 0.13 0.06 0.15 0.03 0.07 0.04 0.03 0.26 0.52 1.43 2.42 1.55 0.09 1-yr 5.06 2.71 0.44 0.35 0.27 0.12 0.15 0.12 0.20 0.54 0.83 1.80 2.58 1.53 0.10 2-yr 4.88 2.48 0.81 0.93 0.61 0.24 0.27 0.39 0.55 0.90 1.21 2.03 2.54 1.52 0.14 5-yr 4.75 2.98 1.60 2.48 1.99 0.84 0.81 1.65 1.37 1.52 1.92 2.38 2.54 1.56 0.39 7-yr 4.75 3.31 1.98 3.21 2.72 1.38 1.30 2.29 1.67 1.85 2.23 2.51 2.61 1.67 0.66 10-yr 4.76 3.74 2.52 3.73 3.39 1.97 1.91 2.86 1.88 2.09 2.43 2.58 2.71 1.76 0.93 20-yr 4.95 4.35 3.46 4.50 4.28 2.70 2.68 3.52 2.20 2.49 2.75 2.73 2.89 2.07 1.47 30-yr 4.85 4.33 3.13 4.60 4.52 3.03 3.08 3.77 2.46 2.86 3.02 2.88 3.04 2.22 1.67


