

Answered step by step
Verified Expert Solution
Question
1 Approved Answer
1. Plot x(t) and h(t). 2. Write a MATLAB code to calculate y(t) in an acceptable range of t. 3. plot y(t). 4. Calculate the
 1. Plot x(t) and h(t).
2. Write a MATLAB code to calculate y(t) in an acceptable range of t.
3. plot y(t).
4. Calculate the function y(t) manually.
5. Compare your MATLAB results with your calculation.
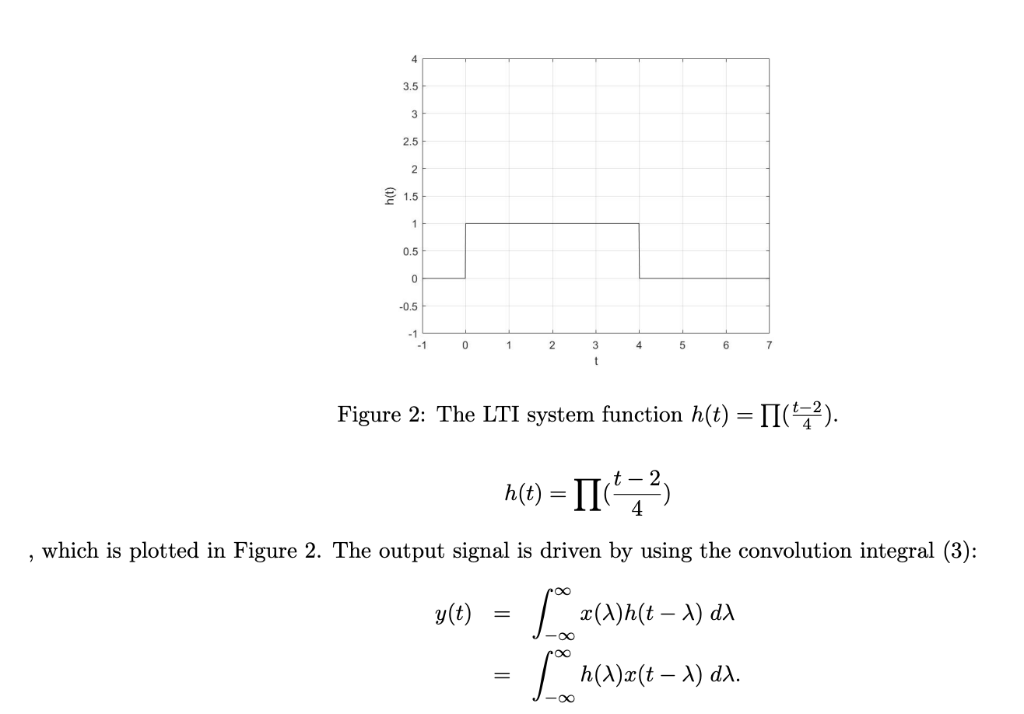
3.5 2.5 1.5 0.5 0.5 Figure 2: The LTI system function h(t) - II2 h(t)-11( 2) , which is plotted in Figure 2. The output signal is driven by using the convolution integral (3): oO h(X)x(t - X) dXStep by Step Solution
There are 3 Steps involved in it
Step: 1

Get Instant Access to Expert-Tailored Solutions
See step-by-step solutions with expert insights and AI powered tools for academic success
Step: 2

Step: 3
Ace Your Homework with AI
Get the answers you need in no time with our AI-driven, step-by-step assistance
Get Started
Mastering Sports Analytics With R Insights From Soccer Nba Nfl Baseball Hockey Tennis Golf And Boxing
Authors: Lauren Gallardo
1st Edition
B0CHGB9X8T, 979-8860571174