

Question
(1 point) Samples were collected from two ponds in the Bahamas to compare salinity values (in parts per thousand). Several samples were drawn at each
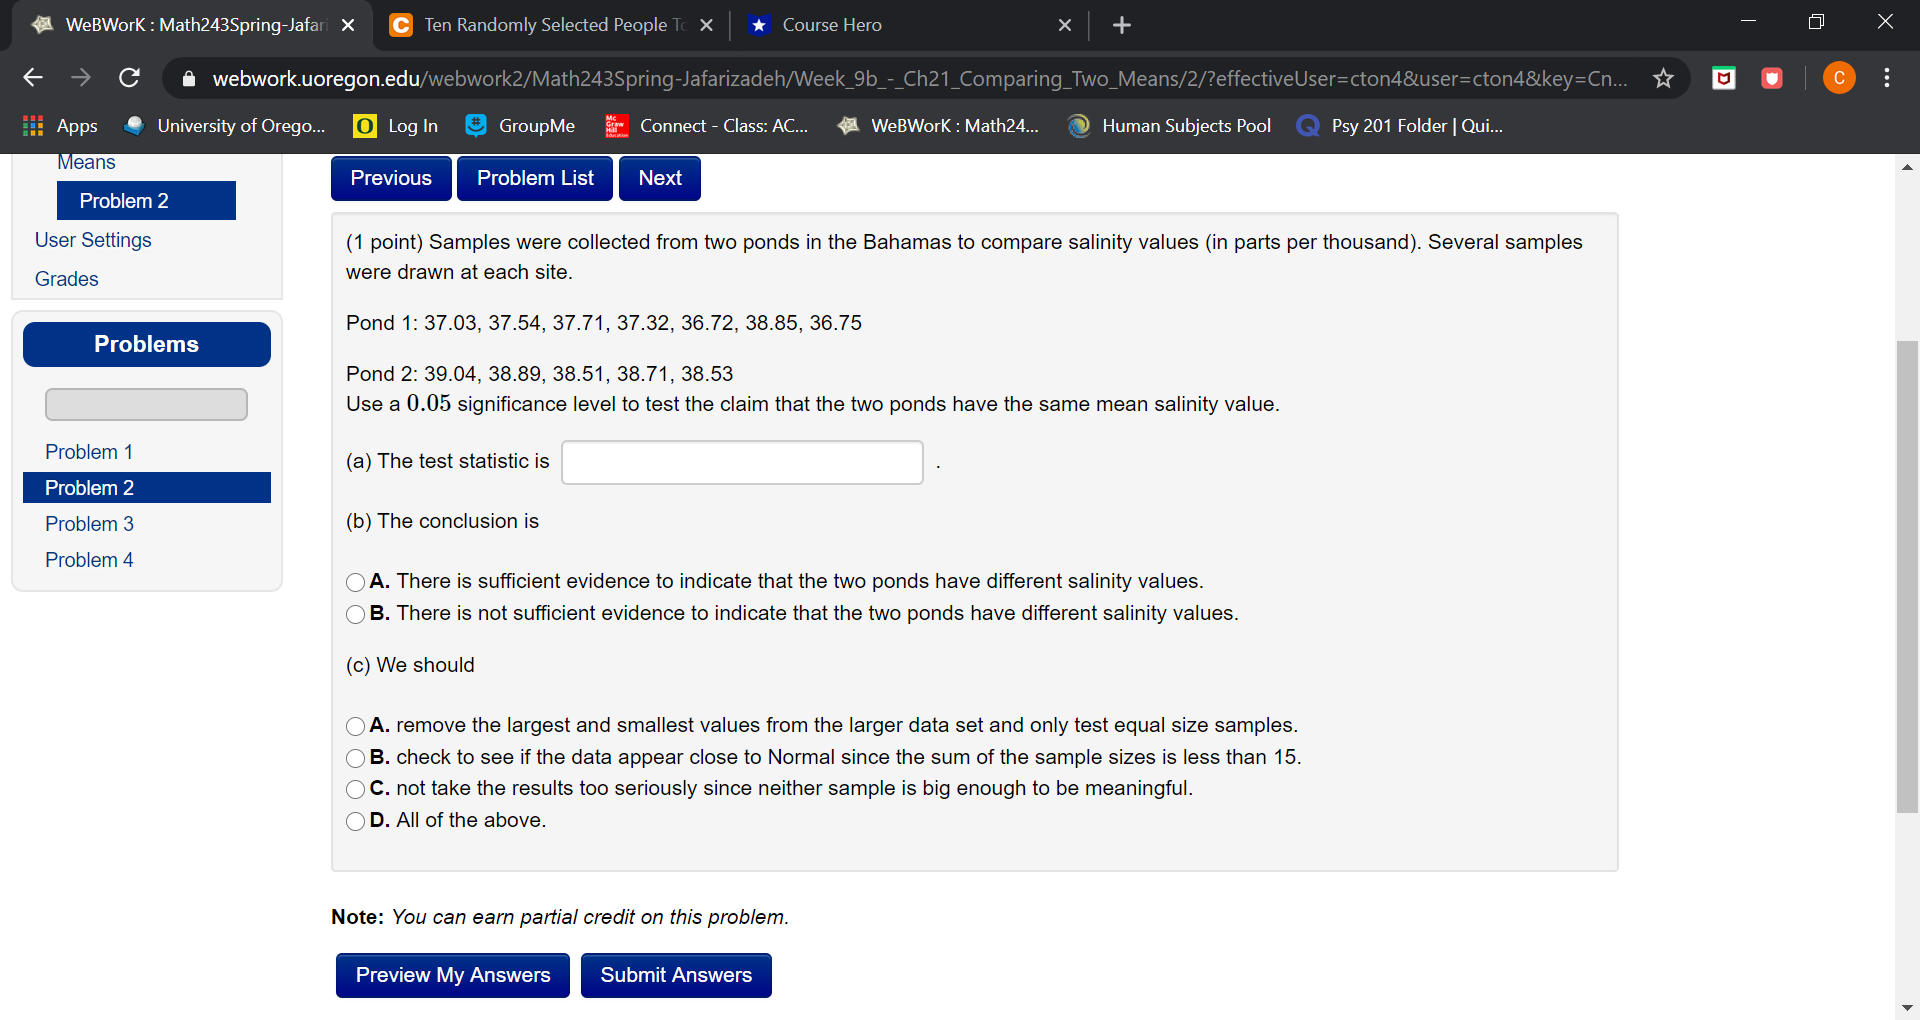
(1 point) Samples were collected from two ponds in the Bahamas to compare salinity values (in parts per thousand). Several samples were drawn at each site.
Pond 1: 37.03, 37.54, 37.71, 37.32, 36.72, 38.85, 36.75
Pond 2: 39.04, 38.89, 38.51, 38.71, 38.53
Use a0.05
0.05significance level to test the claim that the two ponds have the same mean salinity value.
(a) The test statistic is.
(b) The conclusion is
A.There is sufficient evidence to indicate that the two ponds have different salinity values.
B.There is not sufficient evidence to indicate that the two ponds have different salinity values.
(c) We should
A.remove the largest and smallest values from the larger data set and only test equal size samples.
B.check to see if the data appear close to Normal since the sum of the sample sizes is less than 15.
C.not take the results too seriously since neither sample is big enough to be meaningful.
D.All of the above.
Step by Step Solution
There are 3 Steps involved in it
Step: 1

Get Instant Access to Expert-Tailored Solutions
See step-by-step solutions with expert insights and AI powered tools for academic success
Step: 2

Step: 3
Ace Your Homework with AI
Get the answers you need in no time with our AI-driven, step-by-step assistance
Get Started
Cambridge IGCSE And O Level Additional Mathematics
Authors: Val Hanrahan, Jeanette Powell
1st Edition
1510421645, 978-1510421646