Question
1. Predicting Boston Housing Prices. The file BostonHousing.jmp contains information collected by the US Bureau of the Census concerning housing in the area of Boston,
1. Predicting Boston Housing Prices. The file BostonHousing.jmp contains information collected by the US Bureau of the Census concerning housing in the area of Boston, Massachusetts. The dataset includes information on 506 census housing tracts in the Boston area in the 1970s. The goal is to predict the median house price in new tracts based on information such as crime rate, pollution, and number of rooms. The dataset contains 12 predictors, and the response is the median house price (MEDV). Table 6.2 describes each of the predictors and the response.
a. Why should the data be partitioned into training and validation sets? What will the training set be used for? What will the validation set be used for?
b. Fit a multiple linear regression model to the median house price (MEDV) as a function of CRIM, CHAS, and RM. Write the equation for predicting the median house price from the predictors in the model.
c. Using the estimated regression model, what median house price is predicted for a tract in the Boston area that does not bound the Charles River, has a crime rate of 0.1, and where the average number of rooms per house is 6? What is the prediction error?
d. Consider the 12 predictors:
i. Which predictors are likely to be measuring the same thing among the entire set of predictors? Discuss the relationships among INDUS, NOX, and TAX.
ii. Compute the correlation table for the numerical predictors and search for highly correlated pairs. These have potential redundancy and can cause multicollinearity. Choose which ones to remove based on this table.
iii. Use an exhaustive search (All Possible Models) to reduce the remaining predictors as follows: First, choose the top three models. Then run each of these models and compare their predictive accuracy for the validation set. Compare RMSE, Cp , AICc , and Validation RSquare. Finally, describe the best model.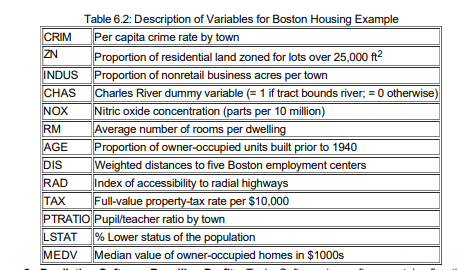
Step by Step Solution
There are 3 Steps involved in it
Step: 1

Get Instant Access to Expert-Tailored Solutions
See step-by-step solutions with expert insights and AI powered tools for academic success
Step: 2

Step: 3
Ace Your Homework with AI
Get the answers you need in no time with our AI-driven, step-by-step assistance
Get Started