1. Prepare common-sized financial statements for Leslie Fay for the period 1987 1991. For that same period, compute for Leslie Fay the ratios shown in Exhibit 2. Given these data, which financial statement items do you believe should have been of particular interest to BDO Seidman during that firm's 1991 audit of Leslie Fay? Explain.
2. In addition to the data shown in Exhibit 1 and Exhibit 2, what other financial information would you have obtained if you had been responsible for planning the 1991 Leslie Fay audit?
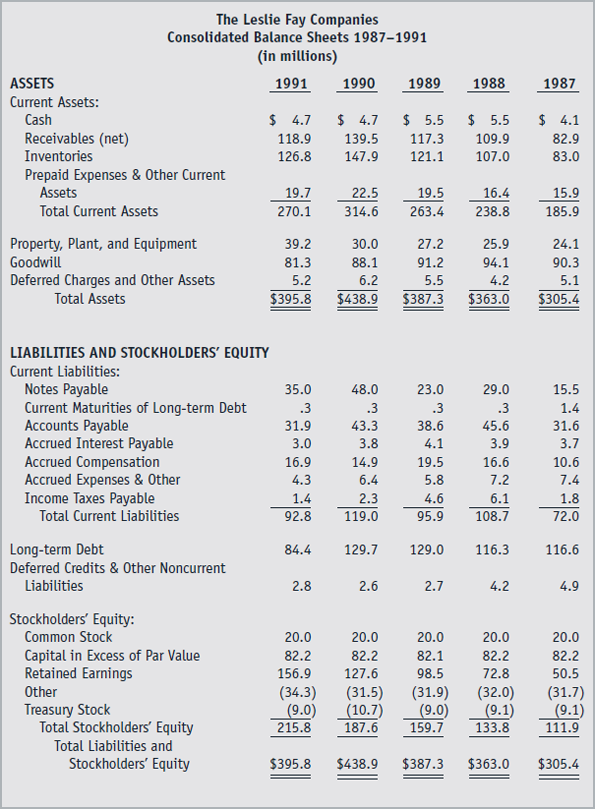
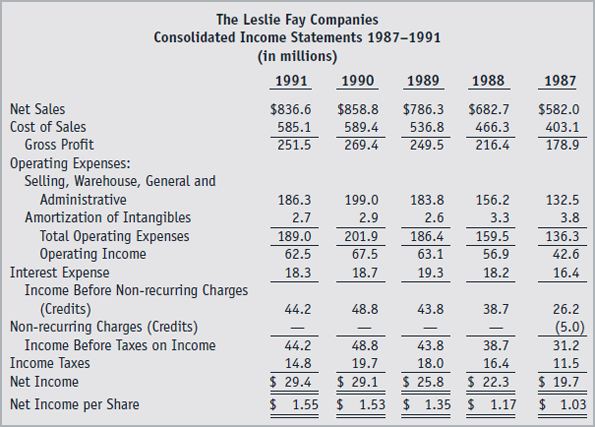
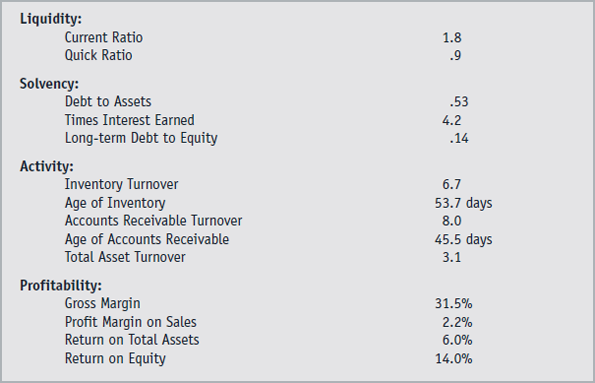
1988 1987 The Leslie Fay Companies Consolidated Balance Sheets 1987-1991 (in millions) ASSETS 1991 1990 1989 Current Assets: Cash $ 4.7 $ 4.7 $ 5.5 Receivables (net) 118.9 139.5 117.3 Inventories 126.8 147.9 121.1 Prepaid Expenses & Other Current Assets 19.7 22.5 19.5 Total Current Assets 270.1 314.6 263.4 Property, Plant, and Equipment 39.2 30.0 27.2 Goodwill 81.3 88.1 91.2 Deferred Charges and Other Assets 5.2 6.2 5.5 Total Assets $395.8 $438.9 $387.3 $ 5.5 109.9 107.0 $ 4.1 82.9 83.0 16.4 238.8 15.9 185.9 25.9 94.1 4.2 $363.0 24.1 90.3 5.1 $305.4 LIABILITIES AND STOCKHOLDERS' EQUITY Current Liabilities: Notes Payable Current Maturities of Long-term Debt Accounts Payable Accrued Interest Payable Accrued Compensation Accrued Expenses & Other Income Taxes Payable Total Current Liabilities Long-term Debt Deferred Credits & Other Noncurrent Liabilities 35.0 .3 31.9 3.0 16.9 4.3 1.4 92.8 48.0 .3 43.3 3.8 14.9 23.0 .3 38.6 4.1 19.5 5.8 4.6 95.9 29.0 .3 45.6 3.9 16.6 7.2 6.1 108.7 15.5 1.4 31.6 3.7 10.6 7.4 1.8 72.0 6.4 2.3 119.0 84.4 129.7 129.0 116.3 116.6 2.8 2.6 2.7 4.2 4.9 Stockholders' Equity: Common Stock Capital in Excess of Par Value Retained Earnings Other Treasury Stock Total Stockholders' Equity Total Liabilities and Stockholders' Equity 20.0 82.2 156.9 (34.3) (9.0) 215.8 20.0 82.2 127.6 (31.5) (10.7) 187.6 20.0 82.1 98.5 (31.9) (9.0) 159.7 20.0 82.2 72.8 (32.0) (9.1) 133.8 20.0 82.2 50.5 (31.7) (9.1) 111.9 $395.8 $438.9 $387.3 $363.0 $305.4 1987 $582.0 403.1 178.9 The Leslie Fay Companies Consolidated Income Statements 1987-1991 (in millions) 1991 1990 1989 1988 Net Sales $836.6 $858.8 $786.3 $682.7 Cost of Sales 585.1 589.4 536.8 466.3 Gross Profit 251.5 269.4 249.5 216.4 Operating Expenses: Selling, Warehouse, General and Administrative 186.3 199.0 183.8 156.2 Amortization of Intangibles 2.7 2.9 2.6 3.3 Total Operating Expenses 189.0 201.9 186.4 159.5 Operating Income 62.5 67.5 63.1 56.9 Interest Expense 18.3 18.7 19.3 18.2 Income Before Non-recurring Charges (Credits) 44.2 48.8 43.8 38.7 Non-recurring Charges (Credits) Income Before Taxes on Income 44.2 48.8 43.8 38.7 Income Taxes 14.8 19.7 18.0 16.4 Net Income $ 29.4 $ 29.1 $ 25.8 $ 22.3 Net Income per Share $ 1.55 $ 1.53 $ 1.35 $ 1.17 132.5 3.8 136.3 42.6 16.4 26.2 (5.0) 31.2 11.5 $ 19.7 $ 1.03 1.8 .9 .53 4.2 .14 Liquidity: Current Ratio Quick Ratio Solvency: Debt to Assets Times Interest Earned Long-term Debt to Equity Activity: Inventory Turnover Age of Inventory Accounts Receivable Turnover Age of Accounts Receivable Total Asset Turnover Profitability: Gross Margin Profit Margin on Sales Return on Total Assets Return on Equity 6.7 53.7 days 8.0 45.5 days 3.1 31.5% 2.2% 6.0% 14.0% 1988 1987 The Leslie Fay Companies Consolidated Balance Sheets 1987-1991 (in millions) ASSETS 1991 1990 1989 Current Assets: Cash $ 4.7 $ 4.7 $ 5.5 Receivables (net) 118.9 139.5 117.3 Inventories 126.8 147.9 121.1 Prepaid Expenses & Other Current Assets 19.7 22.5 19.5 Total Current Assets 270.1 314.6 263.4 Property, Plant, and Equipment 39.2 30.0 27.2 Goodwill 81.3 88.1 91.2 Deferred Charges and Other Assets 5.2 6.2 5.5 Total Assets $395.8 $438.9 $387.3 $ 5.5 109.9 107.0 $ 4.1 82.9 83.0 16.4 238.8 15.9 185.9 25.9 94.1 4.2 $363.0 24.1 90.3 5.1 $305.4 LIABILITIES AND STOCKHOLDERS' EQUITY Current Liabilities: Notes Payable Current Maturities of Long-term Debt Accounts Payable Accrued Interest Payable Accrued Compensation Accrued Expenses & Other Income Taxes Payable Total Current Liabilities Long-term Debt Deferred Credits & Other Noncurrent Liabilities 35.0 .3 31.9 3.0 16.9 4.3 1.4 92.8 48.0 .3 43.3 3.8 14.9 23.0 .3 38.6 4.1 19.5 5.8 4.6 95.9 29.0 .3 45.6 3.9 16.6 7.2 6.1 108.7 15.5 1.4 31.6 3.7 10.6 7.4 1.8 72.0 6.4 2.3 119.0 84.4 129.7 129.0 116.3 116.6 2.8 2.6 2.7 4.2 4.9 Stockholders' Equity: Common Stock Capital in Excess of Par Value Retained Earnings Other Treasury Stock Total Stockholders' Equity Total Liabilities and Stockholders' Equity 20.0 82.2 156.9 (34.3) (9.0) 215.8 20.0 82.2 127.6 (31.5) (10.7) 187.6 20.0 82.1 98.5 (31.9) (9.0) 159.7 20.0 82.2 72.8 (32.0) (9.1) 133.8 20.0 82.2 50.5 (31.7) (9.1) 111.9 $395.8 $438.9 $387.3 $363.0 $305.4 1987 $582.0 403.1 178.9 The Leslie Fay Companies Consolidated Income Statements 1987-1991 (in millions) 1991 1990 1989 1988 Net Sales $836.6 $858.8 $786.3 $682.7 Cost of Sales 585.1 589.4 536.8 466.3 Gross Profit 251.5 269.4 249.5 216.4 Operating Expenses: Selling, Warehouse, General and Administrative 186.3 199.0 183.8 156.2 Amortization of Intangibles 2.7 2.9 2.6 3.3 Total Operating Expenses 189.0 201.9 186.4 159.5 Operating Income 62.5 67.5 63.1 56.9 Interest Expense 18.3 18.7 19.3 18.2 Income Before Non-recurring Charges (Credits) 44.2 48.8 43.8 38.7 Non-recurring Charges (Credits) Income Before Taxes on Income 44.2 48.8 43.8 38.7 Income Taxes 14.8 19.7 18.0 16.4 Net Income $ 29.4 $ 29.1 $ 25.8 $ 22.3 Net Income per Share $ 1.55 $ 1.53 $ 1.35 $ 1.17 132.5 3.8 136.3 42.6 16.4 26.2 (5.0) 31.2 11.5 $ 19.7 $ 1.03 1.8 .9 .53 4.2 .14 Liquidity: Current Ratio Quick Ratio Solvency: Debt to Assets Times Interest Earned Long-term Debt to Equity Activity: Inventory Turnover Age of Inventory Accounts Receivable Turnover Age of Accounts Receivable Total Asset Turnover Profitability: Gross Margin Profit Margin on Sales Return on Total Assets Return on Equity 6.7 53.7 days 8.0 45.5 days 3.1 31.5% 2.2% 6.0% 14.0%