1. Produce the summary table of the modified dataframe. Does any statistic about each variable raise any suspicious of bad data? Hide summary (Galton2) father
1.
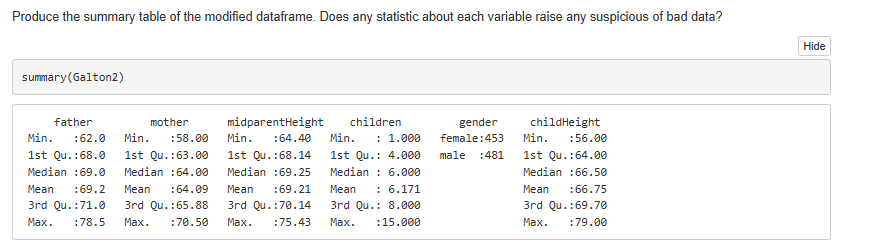
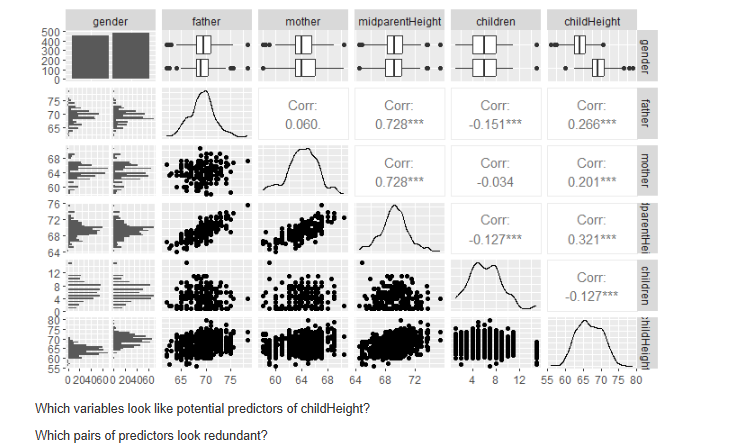
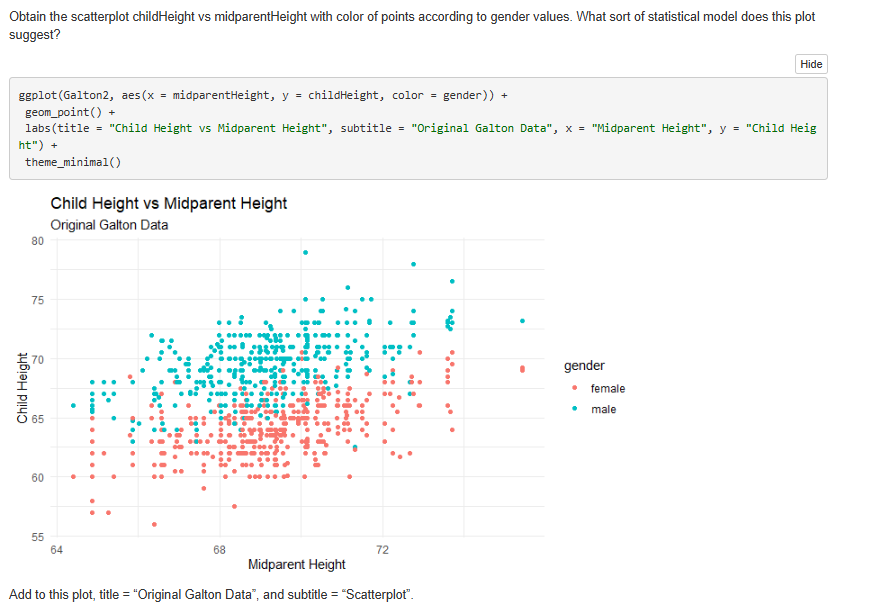
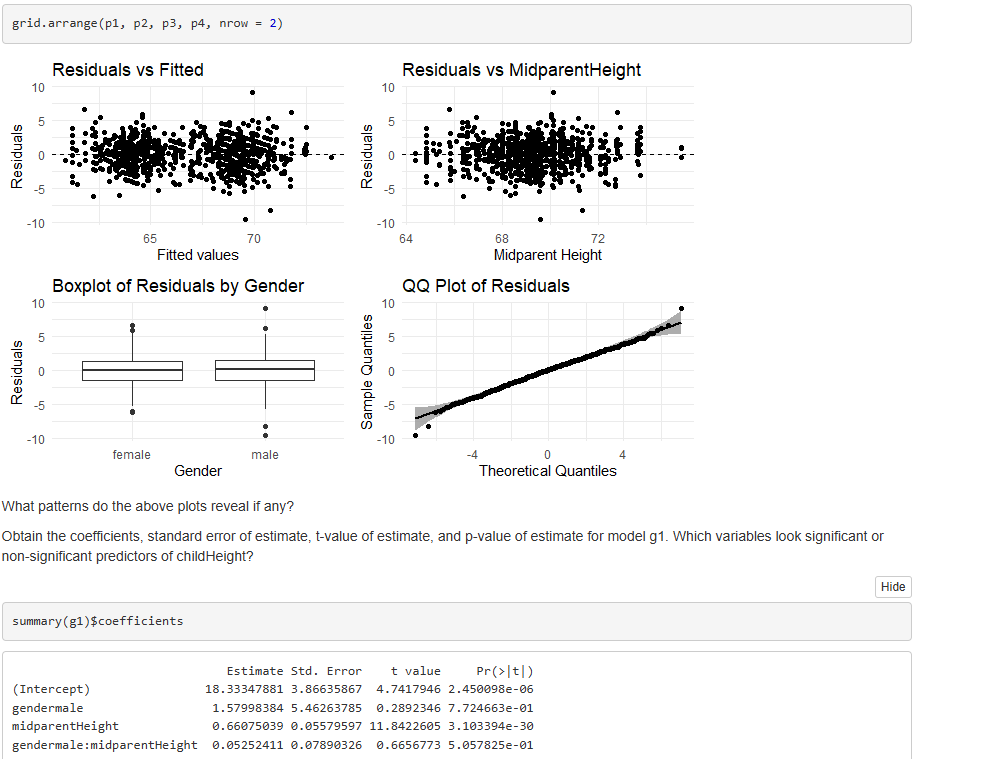
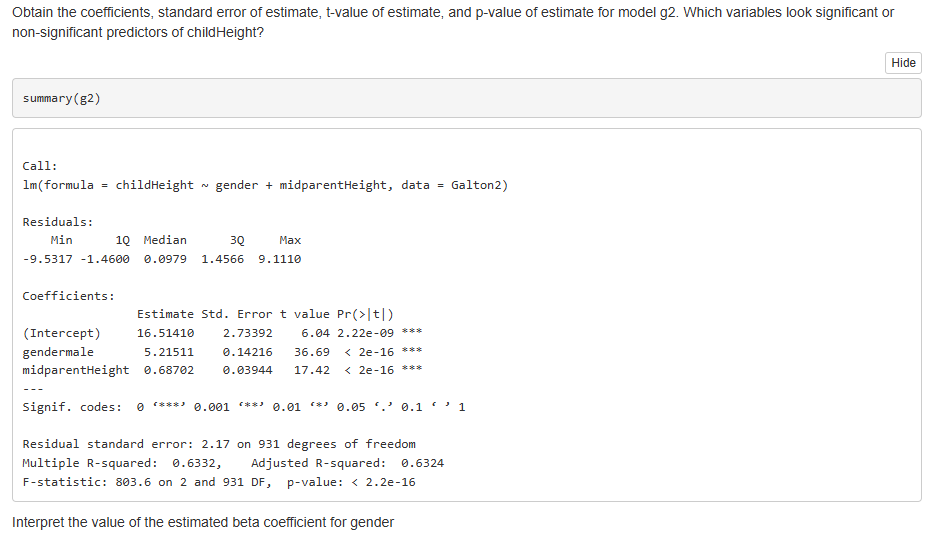
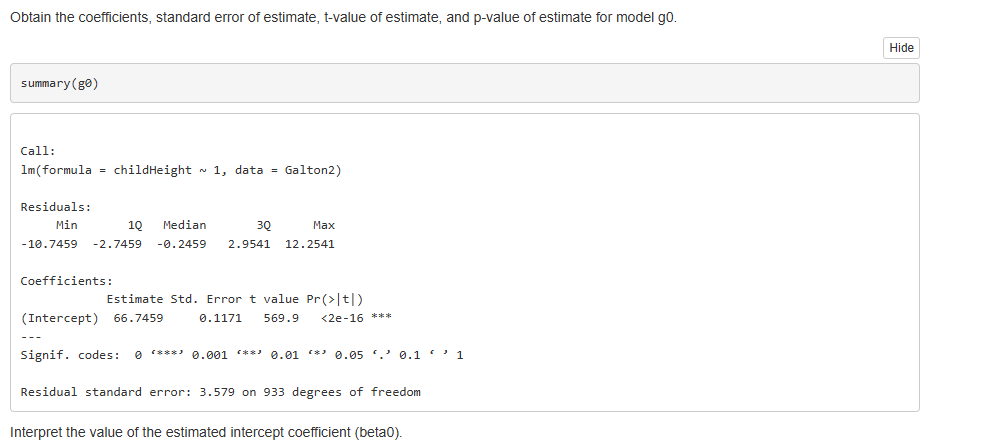
Produce the summary table of the modified dataframe. Does any statistic about each variable raise any suspicious of bad data? Hide summary (Galton2) father mother midparentHeight children gender childHeight Min. : 62.0 Min. : 58.00 Min. : 64.40 Min. : 1.090 female : 453 Min. : 56.00 1st Qu. :68.0 1st Qu. : 63.00 1st Qu. :68.14 1st Qu. : 4.090 male :481 1st Qu. : 64.00 Median :69.0 Median :64.00 Median :69.25 Median : 6.090 Median :66.50 Mean : 69.2 Mean : 64.09 Mean : 69 . 21 Mean : 6.171 Mean : 66.75 3rd Qu. :71.0 3rd Qu. : 65.88 3rd Qu. :70.14 3rd Qu. : 8.090 3rd Qu. : 69.70 Max . :78.5 Max. :70.50 Max. :75.43 Max. : 15.090 Max. :79.00gender father mother midparentHeight children childHeight 500 - 400 - 300 - 200 - gender 100 - II- 0 - 75- Corr: Corr: Corr: Corr: 70 - father 65 - 0.060 0.728*** -0. 151** * 0.266* * * 68 - F Corr: Corr: Corr: 64 - mother 60 - 0.728*** -0.034 0.201* *2 76 -- 72 -2 Corr. Corr: IparentHei 68- -0.127** * 0.321* * * 64 - 12- 8 Corr: children -0.127** * 8 75 childHeight 0 204060 0 204060 65 70 75 60 64 68 64 68 72 4 8 12 55 60 65 70 75 80 Which variables look like potential predictors of childHeight? Which pairs of predictors look redundant?Obtain the scatterplot childHeight vs midparentHeight with color of points according to gender values. What sort of statistical model does this plot suggest? Hide ggplot (Galton2, aes (x = midparentHeight, y = childHeight, color = gender) ) + geom_point ( ) + labs (title = "Child Height vs Midparent Height", subtitle = "Original Galton Data", x = "Midparent Height", y = "Child Heig ht") + theme_minimal( ) Child Height vs Midparent Height Original Galton Data 80 75 70 gender Child Height female male 65 60 55 64 68 72 Midparent Height Add to this plot, title = "Original Galton Data", and subtitle = "Scatterplot".grid. arrange (pl, p2, p3, p4, nrow = 2) Residuals vs Fitted Residuals vs MidparentHeight 10 11 Residuals Residuals -5 -10 -10 65 70 64 68 72 Fitted values Midparent Height Boxplot of Residuals by Gender QQ Plot of Residuals 10 10 O Sample Quantiles Residuals 0 -5 -5 -10 -10 female male -4 0 Gender Theoretical Quantiles What patterns do the above plots reveal if any? Obtain the coefficients, standard error of estimate, t-value of estimate, and p-value of estimate for model g1. Which variables look significant or non-significant predictors of childHeight? Hide summary (g1)$coefficients Estimate Std. Error t value pr (> |+1) (Intercept) 18. 33347881 3.86635867 4.7417946 2.450098e-06 gendermale 1. 57998384 5.46263785 0.2892346 7.724663e-01 midparentHeight 0. 66075039 0.05579597 11.8422605 3.103394e-30 gendermale : midparentHeight 0.05252411 0.07890326 0.6656773 5.057825e-01Obtain the coefficients, standard error of estimate, t-value of estimate, and p-value of estimate for model g2. Which variables look significant or non-significant predictors of childHeight? Hide summary (82) Call: 1m( formula = childHeight ~ gender + midparentHeight, data = Galton2) Residuals: Min 1Q Median 30 Max -9.5317 -1.4600 0.0979 1.4566 9. 1110 Coefficients: Estimate Std. Error t value Pr(>|t|) (Intercept) 16.51410 2.73392 6.04 2.22e-09 **$ gendermale 5 . 21511 0. 14216 36.69 ' 0.01 (*' 0.05 6. ' 0.1 '' Residual standard error: 2.17 on 931 degrees of freedom Multiple R-squared: 0.6332, Adjusted R-squared: 0.6324 F-statistic: 803.6 on 2 and 931 DF, p-value: |t|) (Intercept) 66.7459 0.1171 569.9 ' 0.01 (*' 0.05 ' .' 0.1 ' ' 1 Residual standard error: 3.579 on 933 degrees of freedom Interpret the value of the estimated intercept coefficient (beta0)
Step by Step Solution
There are 3 Steps involved in it
Step: 1
Get Instant Access to Expert-Tailored Solutions
See step-by-step solutions with expert insights and AI powered tools for academic success
Step: 2
Step: 3
Ace Your Homework with AI
Get the answers you need in no time with our AI-driven, step-by-step assistance