

Question
1.) Projects A and B both have 5 years of life. The initial investments and cash flows from these two projects are shown below. Year
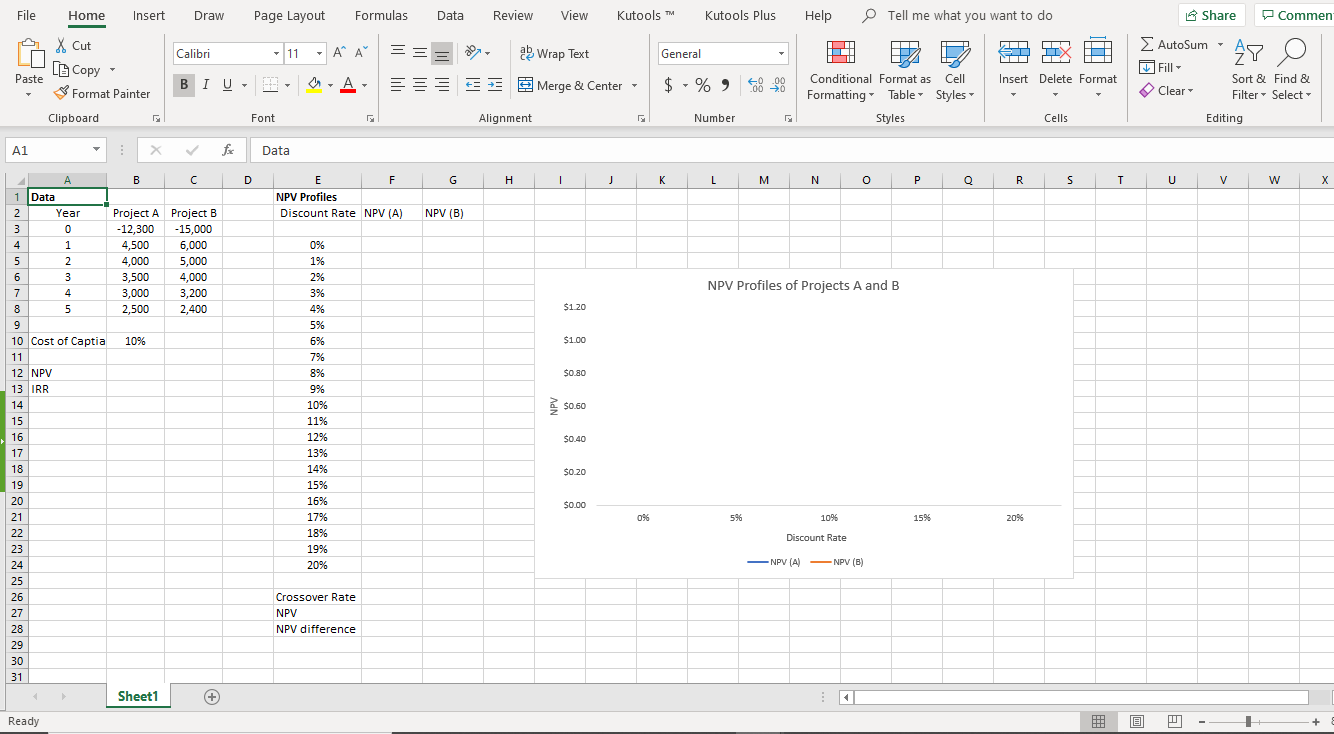
1.) Projects A and B both have 5 years of life. The initial investments and cash flows from these two projects are shown below.
| Year | 0 | 1 | 2 | 3 | 4 | 5 |
| Project A | -12,300 | 4,500 | 4,000 | 3,500 | 3,000 | 2,500 |
| Project B | -15,000 | 6,000 | 5,000 | 4,000 | 3,200 | 2,400 |
A.) Use Data Table tool to find the NPVs of both projects when the discount rate is 10%.
B.) Use Data Table tool to find the IRRs of both projects
C.) Plot the NPV profiles for both projects on the same graph.
D.) Use Goal Seek to find the crossover rate of these two projects. (Note that the solution of this part must include an image of the Goal Seek dialog showing all input values. The image can be shown in a non-Excel file.)
Please show all cells like the given picture (same format if possible). I need to know which cells to use and input. Please show the entire excel file.
PLEASE! USE EXCL! I have posted this problem several times, and each time I have gotten NOTHING! PLEASE PLEASE PLEASE HELP ME! Show your work using excel, showing all the cells you used and step by step instructions on how you used goal seek!
Step by Step Solution
There are 3 Steps involved in it
Step: 1

Get Instant Access to Expert-Tailored Solutions
See step-by-step solutions with expert insights and AI powered tools for academic success
Step: 2

Step: 3
Ace Your Homework with AI
Get the answers you need in no time with our AI-driven, step-by-step assistance
Get Started
Understanding Housing Finance
Authors: Peter King
2nd Edition
0415432952, 978-0415432955