

Question
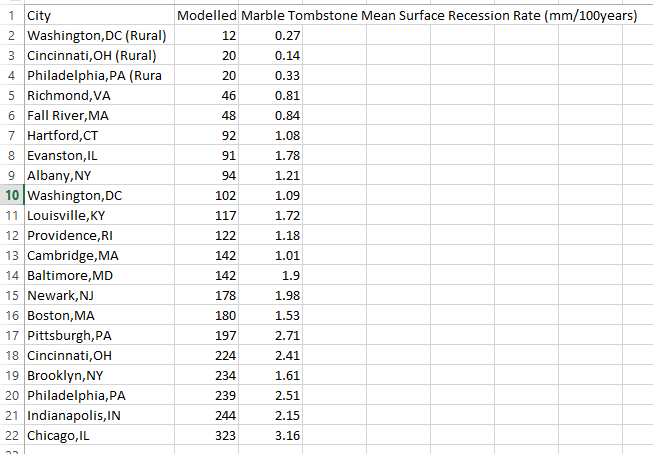
1. Read into R. Use response variable = Marble Tombstone Mean Surface Recession Rate, and covariate = Mean SO2 concentrations over a 100 year period.
1. Read into R. Use response variable = Marble Tombstone Mean Surface Recession Rate, and covariate = Mean SO2 concentrations over a 100 year period. Description: Marble Tombstone Mean Surface Recession Rates and Mean SO2 concentrations over a 100 year period.
2. Obtain R2 , explain what it means.
3. Perform the following hypothesis testing and interval estimation using lm() and other related R functions.
3.1. Perform hypothesis tests for each coefficient, obtain p values, interpret the results, make a conclusion (i.e. reject or not reject) and explain why. Note: please explain what the null hypothesis is.
3.2. Compute interval estimation for coefficients, interpret the meanings of these quantities.
3.3. Make prediction of the Recession Rate at the 1st, 2nd, 3rd, ., 99th percentiles of the SO2, and obtain their prediction intervals (two types of the intervals).
3.4. Plot data points, the regression line, the predictions and its intervals (two types) and show that the interval is wider on both sides and narrow in the center.
3.5. Making prediction at what range of values of SO2 would be considered extrapolation? Is it OK to do extrapolation in this case?
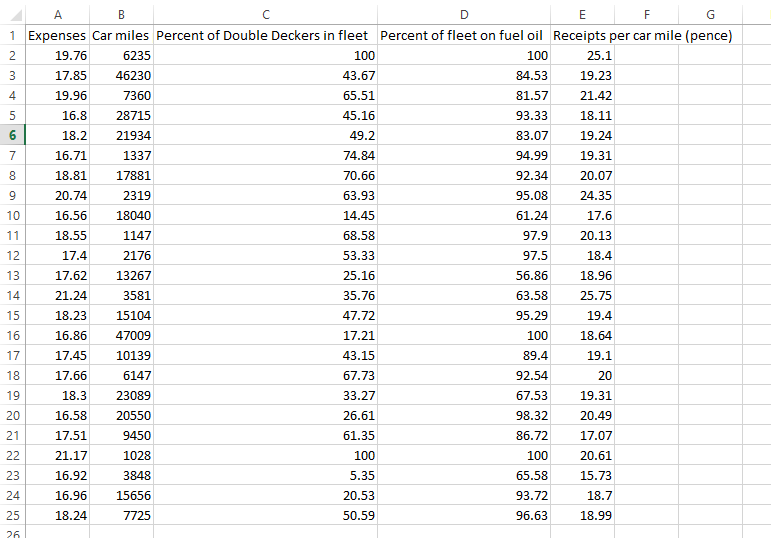
4. Repeat the same questions (1-3) for the date set . Description: Cross-sectional analysis of 24 British bus companies (1951). Use response variable = Expenses per car mile (pence), covariate = Car miles per year (1000s).
tombstone
bus
Step by Step Solution
There are 3 Steps involved in it
Step: 1

Get Instant Access to Expert-Tailored Solutions
See step-by-step solutions with expert insights and AI powered tools for academic success
Step: 2

Step: 3
Ace Your Homework with AI
Get the answers you need in no time with our AI-driven, step-by-step assistance
Get Started
Relational Database And Transact SQL
Authors: Lucy Scott
1st Edition
1974679985, 978-1974679980