

Question
1. Recall that the GSS sample includes men and women from 18 to 89 years of age. Does it matter that we may have responses
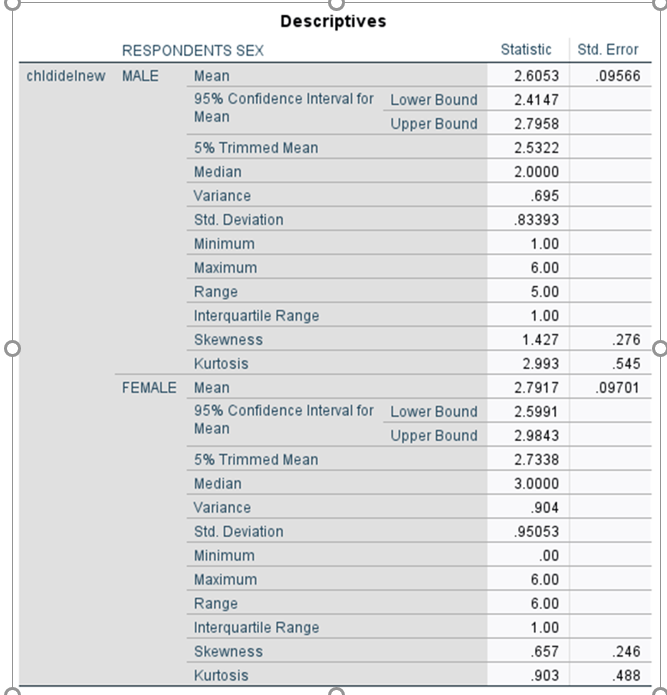 1. Recall that the GSS sample includes men and women from 18 to 89 years of age. Does it matter that we may have responses from men and women of diverse ages? Would our results change if we selected a younger sample of men and women? To take the SPSS demonstration one step further, use the Select Cases procedure to select respondents based on the variable AGE who are less than or equal to 35 years old. Do this by selecting Data and then Select Cases. Next, select If Condition is satisfied and then click on If. Find and highlight the variable AGE in the scroll-down box on the left of your screen. Click the arrow next to the scroll-down box. AGE will now appear in the box on the right. Now, tell SPSS that you want to select respondents who are 35 years of age or less. The box on the right should now read AGE Std. Error .09566 Descriptives RESPONDENTS SEX chldidelnew MALE Mean 95% Confidence interval for Lower Bound Mean Upper Bound 5% Trimmed Mean Median Variance Std. Deviation Minimum Maximum Range Interquartile Range Skewness Kurtosis FEMALE Mean 95% Confidence Interval for Lower Bound Mean Upper Bound 5% Trimmed Mean Median Variance Std. Deviation Minimum Maximum Range Interquartile Range Skewness Kurtosis Statistic 2.6053 2.4147 2.7958 2.5322 2.0000 .695 .83393 1.00 6.00 5.00 1.00 1.427 2.993 2.7917 2.5991 2.9843 2.7338 3.0000 .904 .95053 .00 6.00 6.00 1.00 .657 .903 .276 .545 .09701 .246 .488 Std. Error .09566 Descriptives RESPONDENTS SEX chldidelnew MALE Mean 95% Confidence interval for Lower Bound Mean Upper Bound 5% Trimmed Mean Median Variance Std. Deviation Minimum Maximum Range Interquartile Range Skewness Kurtosis FEMALE Mean 95% Confidence Interval for Lower Bound Mean Upper Bound 5% Trimmed Mean Median Variance Std. Deviation Minimum Maximum Range Interquartile Range Skewness Kurtosis Statistic 2.6053 2.4147 2.7958 2.5322 2.0000 .695 .83393 1.00 6.00 5.00 1.00 1.427 2.993 2.7917 2.5991 2.9843 2.7338 3.0000 .904 .95053 .00 6.00 6.00 1.00 .657 .903 .276 .545 .09701 .246 .488
Step by Step Solution
There are 3 Steps involved in it
Step: 1

Get Instant Access to Expert-Tailored Solutions
See step-by-step solutions with expert insights and AI powered tools for academic success
Step: 2

Step: 3
Ace Your Homework with AI
Get the answers you need in no time with our AI-driven, step-by-step assistance
Get Started
Accounting Tools for business decision making
Authors: kimmel, weygandt, kieso
4th Edition
978-0470117262, 9780470534786, 470117265, 470534788, 978-0470095461