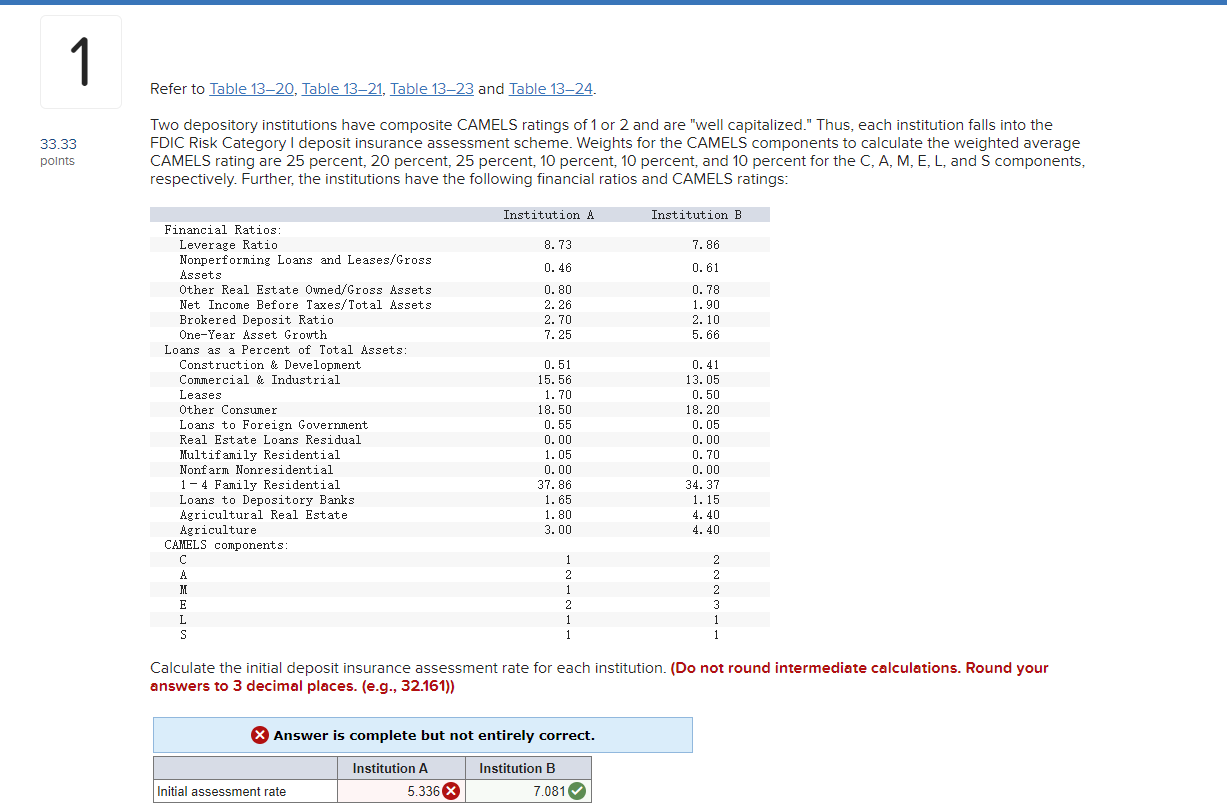
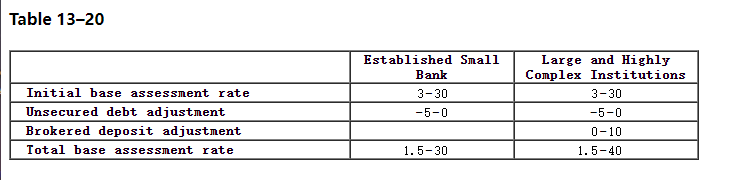
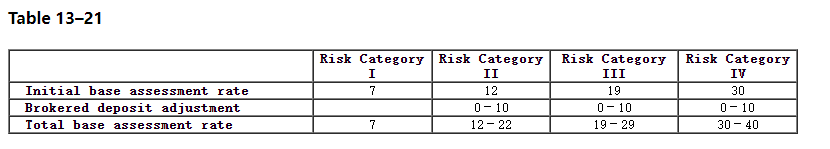
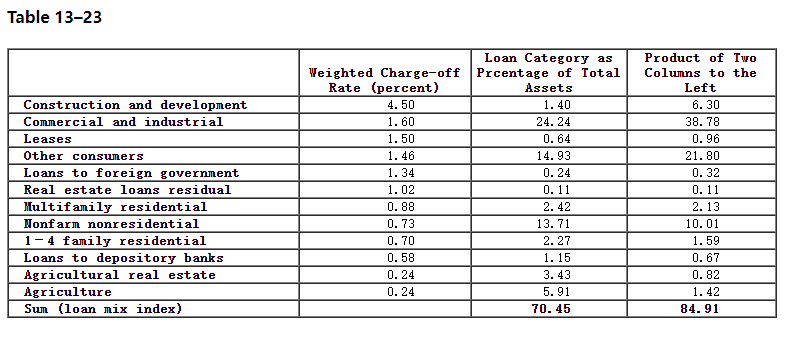
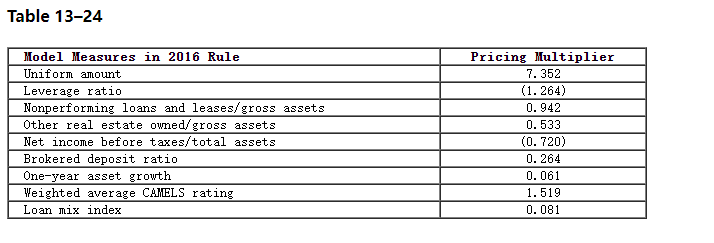
1 Refer to Table 1320, Table 13-21, Table 13-23 and Table 13-24. 33.33 points Two depository institutions have composite CAMELS ratings of 1 or 2 and are "well capitalized." Thus, each institution falls into the FDIC Risk Category I deposit insurance assessment scheme. Weights for the CAMELS components to calculate the weighted average CAMELS rating are 25 percent, 20 percent, 25 percent, 10 percent, 10 percent, and 10 percent for the C, A, M, E, L, and S components, respectively. Further, the institutions have the following financial ratios and CAMELS ratings: Institution A Institution B 8. 73 7. 86 0.46 0.61 0.80 2. 26 2.70 7.25 0.78 1.90 2.10 5.66 Financial Ratios: Leverage Ratio Nonperforming Loans and Leases/Gross Assets Other Real Estate Owned/Gross Assets Net Income Before Taxes/Total Assets Brokered Deposit Ratio One-Year Asset Growth Loans as a Percent of Total Assets: Construction & Development Comercial & Industrial Leases Other Consumer Loans to Foreign Government Real Estate Loans Residual Multifamily Residential Nonfarm Nonresidential 1- 4 Family Residential Loans to Depository Banks Agricultural Real Estate Agriculture CAMELS components: A M E L . S S 0.51 15. 56 1.70 18.50 0.55 0.00 1.05 0.00 37.86 1.65 1.80 3.00 0.41 13.05 0.50 18. 20 0.05 0.00 0.70 0.00 34. 37 1.15 4.40 4.40 1 2 1 2 1 1 2 2 2 3 1 1 Calculate the initial deposit insurance assessment rate for each institution. (Do not round intermediate calculations. Round your answers to 3 decimal places. (e.g., 32.161)) Answer is complete but not entirely correct. Institution A 5.336 X Institution B 7.081 Initial assessment rate Table 13-20 Established Small Bank 3-30 -5-0 Initial base assessment rate Unsecured debt adjustment Brokered deposit adjustment Total base assessment rate Large and Highly Complex Institutions 3-30 -5-0 0-10 1.5-40 1.5-30 Table 13-21 Initial base assessment rate Brokered deposit adjustment Total base assessment rate Risk Category Risk Category I II 7 12 0-10 7 12-22 Risk Category III 19 0-10 19-29 Risk Category IV 30 0-10 30-40 Table 13-23 Construction and development Commercial and industrial Leases Other consumers Loans to foreign government Real estate loans residual Multifamily residential Nonfarm nonresidential 1-4 fanily residential Loans to depository banks Agricultural real estate Agriculture Sun (loan nix index) Loan Category as Weighted Charge-off Prcentage of Total Rate (percent) Assets 4.50 1.40 1.60 24. 24 1.50 0.64 1.46 14.93 1. 34 0.24 1.02 0.11 0.88 2. 42 0.73 13. 71 0.70 2.27 0.58 1. 15 0.24 3. 43 0.24 5.91 70.45 Product of Two Columns to the Left 6.30 38. 78 0.96 21. 80 0.32 0.11 2.13 10.01 1.59 0.67 0.82 1.42 84.91 Table 13-24 Model Measures in 2016 Rule Uniform amount Leverage ratio Nonperforming loans and leases/ gross assets Other real estate owned/ gross assets Net income before taxes/total assets Brokered deposit ratio One-year asset growth Weighted average CAMELS rating Loan mix index Pricing Multiplier 7.352 (1.264) 0.942 0.533 (0.720) 0.264 0.061 1.519 0.081 1 Refer to Table 1320, Table 13-21, Table 13-23 and Table 13-24. 33.33 points Two depository institutions have composite CAMELS ratings of 1 or 2 and are "well capitalized." Thus, each institution falls into the FDIC Risk Category I deposit insurance assessment scheme. Weights for the CAMELS components to calculate the weighted average CAMELS rating are 25 percent, 20 percent, 25 percent, 10 percent, 10 percent, and 10 percent for the C, A, M, E, L, and S components, respectively. Further, the institutions have the following financial ratios and CAMELS ratings: Institution A Institution B 8. 73 7. 86 0.46 0.61 0.80 2. 26 2.70 7.25 0.78 1.90 2.10 5.66 Financial Ratios: Leverage Ratio Nonperforming Loans and Leases/Gross Assets Other Real Estate Owned/Gross Assets Net Income Before Taxes/Total Assets Brokered Deposit Ratio One-Year Asset Growth Loans as a Percent of Total Assets: Construction & Development Comercial & Industrial Leases Other Consumer Loans to Foreign Government Real Estate Loans Residual Multifamily Residential Nonfarm Nonresidential 1- 4 Family Residential Loans to Depository Banks Agricultural Real Estate Agriculture CAMELS components: A M E L . S S 0.51 15. 56 1.70 18.50 0.55 0.00 1.05 0.00 37.86 1.65 1.80 3.00 0.41 13.05 0.50 18. 20 0.05 0.00 0.70 0.00 34. 37 1.15 4.40 4.40 1 2 1 2 1 1 2 2 2 3 1 1 Calculate the initial deposit insurance assessment rate for each institution. (Do not round intermediate calculations. Round your answers to 3 decimal places. (e.g., 32.161)) Answer is complete but not entirely correct. Institution A 5.336 X Institution B 7.081 Initial assessment rate Table 13-20 Established Small Bank 3-30 -5-0 Initial base assessment rate Unsecured debt adjustment Brokered deposit adjustment Total base assessment rate Large and Highly Complex Institutions 3-30 -5-0 0-10 1.5-40 1.5-30 Table 13-21 Initial base assessment rate Brokered deposit adjustment Total base assessment rate Risk Category Risk Category I II 7 12 0-10 7 12-22 Risk Category III 19 0-10 19-29 Risk Category IV 30 0-10 30-40 Table 13-23 Construction and development Commercial and industrial Leases Other consumers Loans to foreign government Real estate loans residual Multifamily residential Nonfarm nonresidential 1-4 fanily residential Loans to depository banks Agricultural real estate Agriculture Sun (loan nix index) Loan Category as Weighted Charge-off Prcentage of Total Rate (percent) Assets 4.50 1.40 1.60 24. 24 1.50 0.64 1.46 14.93 1. 34 0.24 1.02 0.11 0.88 2. 42 0.73 13. 71 0.70 2.27 0.58 1. 15 0.24 3. 43 0.24 5.91 70.45 Product of Two Columns to the Left 6.30 38. 78 0.96 21. 80 0.32 0.11 2.13 10.01 1.59 0.67 0.82 1.42 84.91 Table 13-24 Model Measures in 2016 Rule Uniform amount Leverage ratio Nonperforming loans and leases/ gross assets Other real estate owned/ gross assets Net income before taxes/total assets Brokered deposit ratio One-year asset growth Weighted average CAMELS rating Loan mix index Pricing Multiplier 7.352 (1.264) 0.942 0.533 (0.720) 0.264 0.061 1.519 0.081