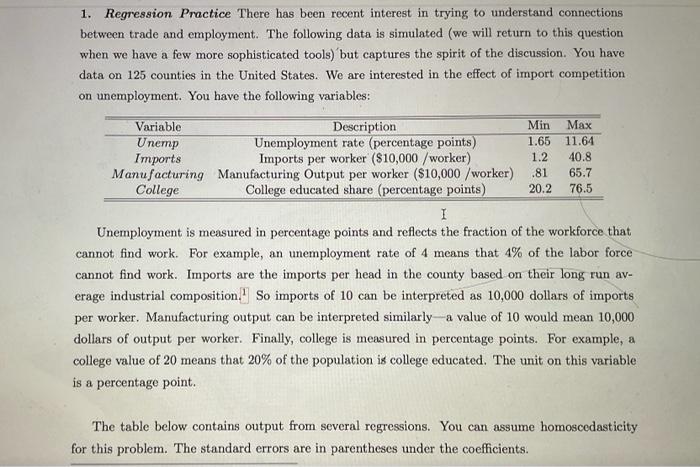
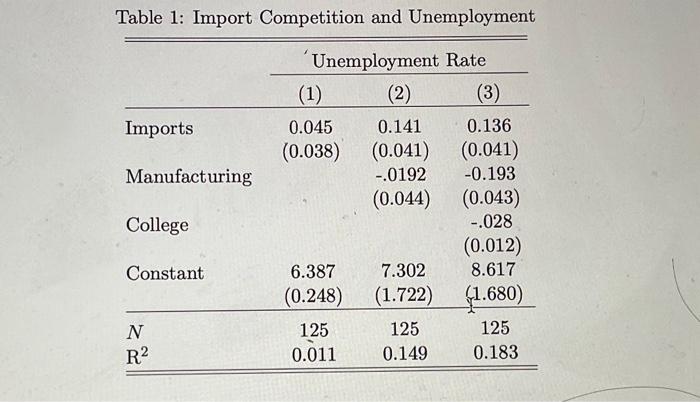
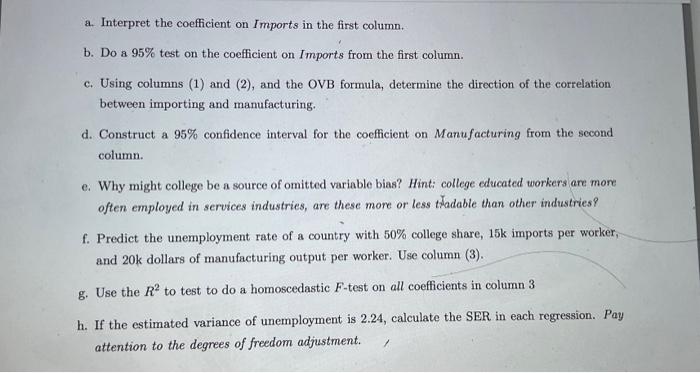
1. Regression Practice There has been recent interest in trying to understand connections between trade and employment. The following data is simulated (we will return to this question when we have a few more sophisticated tools) but captures the spirit of the discussion. You have data on 125 counties in the United States. We are interested in the effect of import competition on unemployment. You have the following variables: Unemployment is measured in percentage points and reflects the fraction of the workforce that cannot find work. For example, an unemployment rate of 4 means that 4% of the labor force cannot find work. Imports are the imports per head in the county based on their long run average industrial composition. 1 So imports of 10 can be interpreted as 10,000 dollars of imports per worker. Manufacturing output can be interpreted similarly - a value of 10 would mean 10,000 dollars of output per worker. Finally, college is measured in percentage points. For example, a college value of 20 means that 20% of the population is college educated. The unit on this variable is a percentage point. The table below contains output from several regressions. You can assume homoscedasticity for this problem. The standard errors are in parentheses under the coefficients. Table 1: Import Competition and Unemployment a. Interpret the coefficient on Imports in the first column. b. Do a 95% test on the coefficient on Imports from the first column. c. Using columns (1) and (2), and the OVB formula, determine the direction of the correlation between importing and manufacturing. d. Construct a 95% confidence interval for the coefficient on Manufacturing from the second column. e. Why might college be a source of omitted variable bias? Hint: college educated workers are more often employed in services industries, are these more or less thadable than other industries? f. Predict the unemployment rate of a country with 50% college share, 15k imports per worker, and 20k dollars of manufacturing output per worker. Use column (3). g. Use the R2 to test to do a homoscedastic F-test on all coefficients in column 3 h. If the estimated variance of unemployment is 2.24, calculate the SER in each regression. Pay attention to the degrees of freedom adjustment. 1. Regression Practice There has been recent interest in trying to understand connections between trade and employment. The following data is simulated (we will return to this question when we have a few more sophisticated tools) but captures the spirit of the discussion. You have data on 125 counties in the United States. We are interested in the effect of import competition on unemployment. You have the following variables: Unemployment is measured in percentage points and reflects the fraction of the workforce that cannot find work. For example, an unemployment rate of 4 means that 4% of the labor force cannot find work. Imports are the imports per head in the county based on their long run average industrial composition. 1 So imports of 10 can be interpreted as 10,000 dollars of imports per worker. Manufacturing output can be interpreted similarly - a value of 10 would mean 10,000 dollars of output per worker. Finally, college is measured in percentage points. For example, a college value of 20 means that 20% of the population is college educated. The unit on this variable is a percentage point. The table below contains output from several regressions. You can assume homoscedasticity for this problem. The standard errors are in parentheses under the coefficients. Table 1: Import Competition and Unemployment a. Interpret the coefficient on Imports in the first column. b. Do a 95% test on the coefficient on Imports from the first column. c. Using columns (1) and (2), and the OVB formula, determine the direction of the correlation between importing and manufacturing. d. Construct a 95% confidence interval for the coefficient on Manufacturing from the second column. e. Why might college be a source of omitted variable bias? Hint: college educated workers are more often employed in services industries, are these more or less thadable than other industries? f. Predict the unemployment rate of a country with 50% college share, 15k imports per worker, and 20k dollars of manufacturing output per worker. Use column (3). g. Use the R2 to test to do a homoscedastic F-test on all coefficients in column 3 h. If the estimated variance of unemployment is 2.24, calculate the SER in each regression. Pay attention to the degrees of freedom adjustment