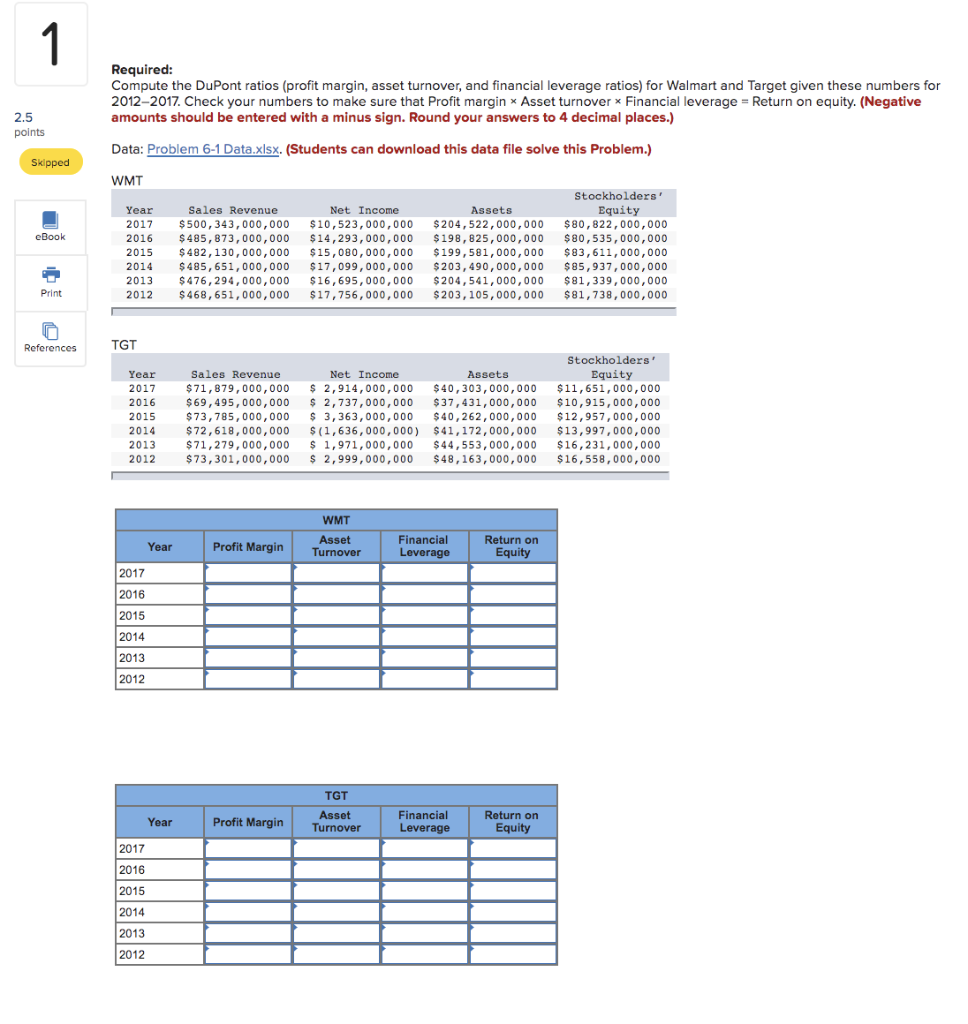
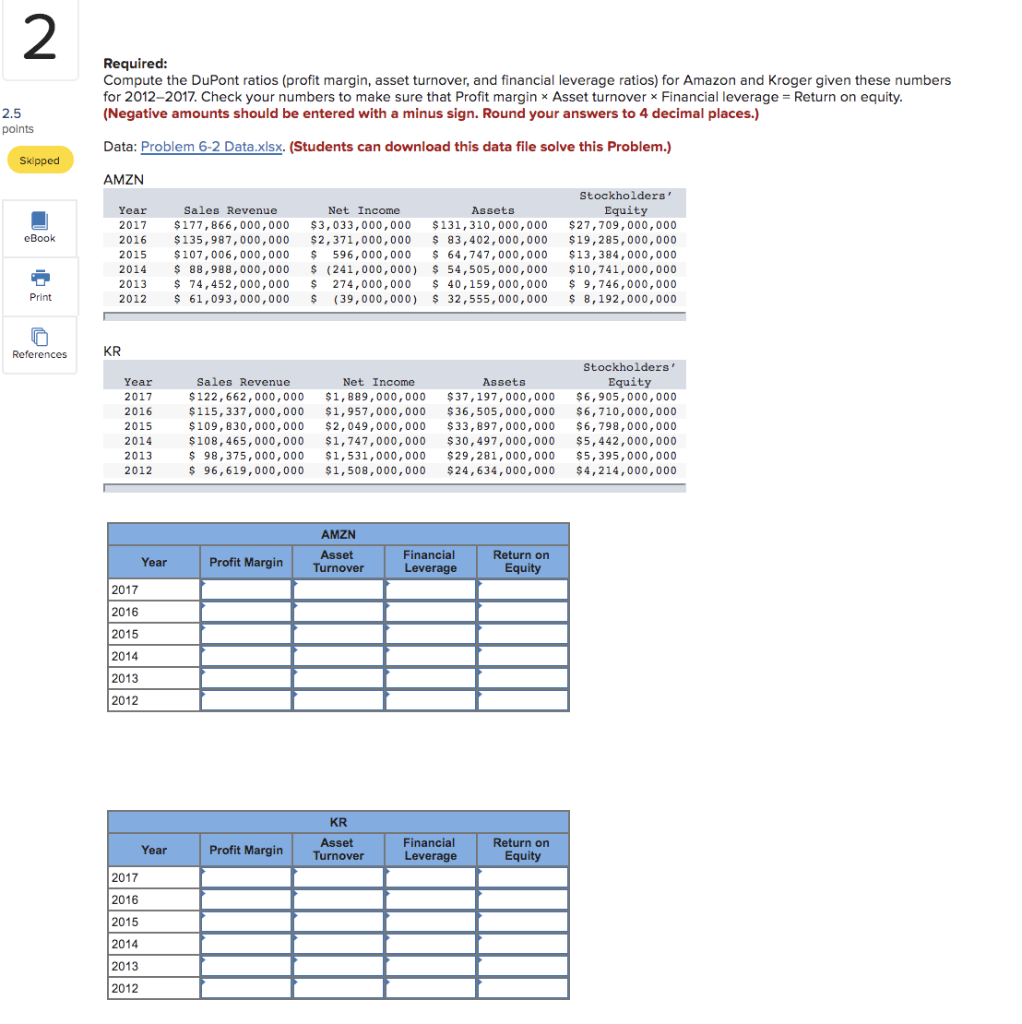
1 Required: Compute the DuPont ratios (profit margin, asset turnover, and financial leverage ratios) for Walmart and Target given these numbers for 2012-2017. Check your numbers to make sure that Profit margin * Asset turnover * Financial leverage = Return on equity. (Negative amounts should be entered with a minus sign. Round your answers to 4 decimal places.) 2.5 points Data: Problem 6-1 Data.xlsx. (Students can download this data file solve this problem.) Skipped WMT eBook Year 2017 2016 2015 2014 2013 2012 Sales Revenue Net Income $500,343,000,000 $10,523,000,000 $ 485, 873,000,000 $14,293,000,000 $482,130,000,000 $15,080,000,000 $ 485,651,000,000 $17,099,000,000 $ 476,294,000,000 $16,695,000,000 $468,651,000,000 $17,756,000,000 Assets $ 204,522,000,000 $198,825,000,000 $199,581,000,000 $203,490,000,000 $ 204,541,000,000 $ 203, 105,000,000 Stockholders' Equity $80,822,000,000 $80,535,000,000 $83,611,000,000 $ 85,937,000,000 $81,339,000,000 $81,738,000,000 Print References TGT Year 2017 2016 2015 2014 2013 2012 Sales Revenue $71,879,000,000 $69,495,000,000 $ 73, 785,000,000 $ 72,618,000,000 $71,279,000,000 $73,301,000,000 Net Income Assets $ 2,914,000,000 $40,303,000,000 $ 2,737,000,000 $ 37,431,000,000 $ 3,363,000,000 $40,262,000,000 $(1,636,000,000) $41,172,000,000 $ 1,971,000,000 $44,553,000,000 $ 2,999,000,000 $48, 163,000,000 Stockholders' Equity $11,651,000,000 $10,915,000,000 $12,957,000,000 $13,997,000,000 $16,231,000,000 $ 16,558,000,000 WMT Asset Turnover Year Profit Margin Financial Leverage Return on Equity 2017 2016 2015 2014 2013 2012 TGT Asset Turnover Year Profit Margin Financial Leverage Return on Equity 2017 2016 2015 2014 2013 2012 2 Required: Compute the DuPont ratios (profit margin, asset turnover, and financial leverage ratios) for Amazon and Kroger given these numbers for 2012-2017. Check your numbers to make sure that Profit margin * Asset turnover * Financial leverage = Return on equity. (Negative amounts should be entered with a minus sign. Round your answers to 4 decimal places.) 2.5 points Data: Problem 6-2 Data.xlsx. (Students can download this data file solve this problem.) Skipped AMZN eBook Year 2017 2016 2015 2014 2013 2012 Sales Revenue Net Income Assets $177,866,000,000 $3,033,000,000 $131,310,000,000 $135,987,000,000 $2,371,000,000 $ 83,402,000,000 $ 107,006,000,000 $ 596,000,000 $ 64,747,000,000 $ 88,988,000,000 $ (241,000,000) $ 54,505,000,000 $ 74,452,000,000 $ 274,000,000 $ 40, 159,000,000 $ 61,093,000,000 $ (39,000,000) $ 32,555,000,000 Stockholders' Equity $27,709,000,000 $19,285,000,000 $13,384,000,000 $10,741,000,000 $ 9,746,000,000 $ 8,192,000,000 Print References KR Year 2017 2016 2015 2014 2013 2012 Sales Revenue $ 122,662,000,000 $115,337,000,000 $109,830,000,000 $108,465,000,000 $ 98,375,000,000 $ 96,619,000,000 Net Income $1,889,000,000 $1,957,000,000 $2,049,000,000 $1,747,000,000 $1,531,000,000 $1,508,000,000 Assets $37,197,000,000 $36,505,000,000 $33,897,000,000 $30,497,000,000 $ 29,281,000,000 $24,634,000,000 Stockholders Equity $6,905,000,000 $6,710,000,000 $6,798,000,000 $5,442,000,000 $5,395,000,000 $4,214,000,000 AMZN Asset Turnover Year Profit Margin Financial Leverage Return on Equity 2017 2016 2015 2014 2013 2012 KR Asset Turnover Year Profit Margin Financial Leverage Return on Equity 2017 2016 2015 2014 2013 2012 1 Required: Compute the DuPont ratios (profit margin, asset turnover, and financial leverage ratios) for Walmart and Target given these numbers for 2012-2017. Check your numbers to make sure that Profit margin * Asset turnover * Financial leverage = Return on equity. (Negative amounts should be entered with a minus sign. Round your answers to 4 decimal places.) 2.5 points Data: Problem 6-1 Data.xlsx. (Students can download this data file solve this problem.) Skipped WMT eBook Year 2017 2016 2015 2014 2013 2012 Sales Revenue Net Income $500,343,000,000 $10,523,000,000 $ 485, 873,000,000 $14,293,000,000 $482,130,000,000 $15,080,000,000 $ 485,651,000,000 $17,099,000,000 $ 476,294,000,000 $16,695,000,000 $468,651,000,000 $17,756,000,000 Assets $ 204,522,000,000 $198,825,000,000 $199,581,000,000 $203,490,000,000 $ 204,541,000,000 $ 203, 105,000,000 Stockholders' Equity $80,822,000,000 $80,535,000,000 $83,611,000,000 $ 85,937,000,000 $81,339,000,000 $81,738,000,000 Print References TGT Year 2017 2016 2015 2014 2013 2012 Sales Revenue $71,879,000,000 $69,495,000,000 $ 73, 785,000,000 $ 72,618,000,000 $71,279,000,000 $73,301,000,000 Net Income Assets $ 2,914,000,000 $40,303,000,000 $ 2,737,000,000 $ 37,431,000,000 $ 3,363,000,000 $40,262,000,000 $(1,636,000,000) $41,172,000,000 $ 1,971,000,000 $44,553,000,000 $ 2,999,000,000 $48, 163,000,000 Stockholders' Equity $11,651,000,000 $10,915,000,000 $12,957,000,000 $13,997,000,000 $16,231,000,000 $ 16,558,000,000 WMT Asset Turnover Year Profit Margin Financial Leverage Return on Equity 2017 2016 2015 2014 2013 2012 TGT Asset Turnover Year Profit Margin Financial Leverage Return on Equity 2017 2016 2015 2014 2013 2012 2 Required: Compute the DuPont ratios (profit margin, asset turnover, and financial leverage ratios) for Amazon and Kroger given these numbers for 2012-2017. Check your numbers to make sure that Profit margin * Asset turnover * Financial leverage = Return on equity. (Negative amounts should be entered with a minus sign. Round your answers to 4 decimal places.) 2.5 points Data: Problem 6-2 Data.xlsx. (Students can download this data file solve this problem.) Skipped AMZN eBook Year 2017 2016 2015 2014 2013 2012 Sales Revenue Net Income Assets $177,866,000,000 $3,033,000,000 $131,310,000,000 $135,987,000,000 $2,371,000,000 $ 83,402,000,000 $ 107,006,000,000 $ 596,000,000 $ 64,747,000,000 $ 88,988,000,000 $ (241,000,000) $ 54,505,000,000 $ 74,452,000,000 $ 274,000,000 $ 40, 159,000,000 $ 61,093,000,000 $ (39,000,000) $ 32,555,000,000 Stockholders' Equity $27,709,000,000 $19,285,000,000 $13,384,000,000 $10,741,000,000 $ 9,746,000,000 $ 8,192,000,000 Print References KR Year 2017 2016 2015 2014 2013 2012 Sales Revenue $ 122,662,000,000 $115,337,000,000 $109,830,000,000 $108,465,000,000 $ 98,375,000,000 $ 96,619,000,000 Net Income $1,889,000,000 $1,957,000,000 $2,049,000,000 $1,747,000,000 $1,531,000,000 $1,508,000,000 Assets $37,197,000,000 $36,505,000,000 $33,897,000,000 $30,497,000,000 $ 29,281,000,000 $24,634,000,000 Stockholders Equity $6,905,000,000 $6,710,000,000 $6,798,000,000 $5,442,000,000 $5,395,000,000 $4,214,000,000 AMZN Asset Turnover Year Profit Margin Financial Leverage Return on Equity 2017 2016 2015 2014 2013 2012 KR Asset Turnover Year Profit Margin Financial Leverage Return on Equity 2017 2016 2015 2014 2013 2012