Answered step by step
Verified Expert Solution
Question
1 Approved Answer
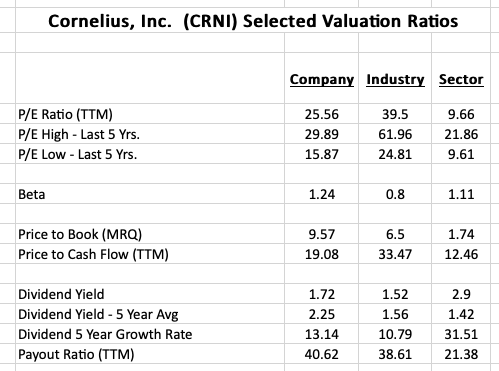
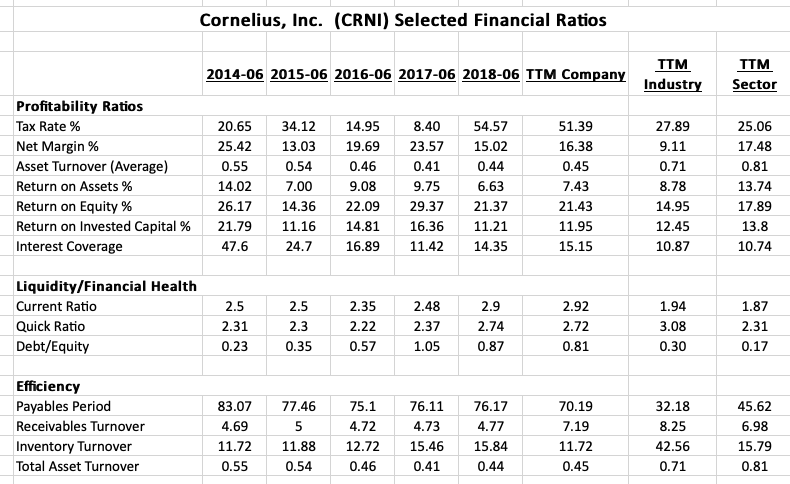
1. Review the table of ratios provided with industry and sector comparisons. Highlight and discuss several key ratios. Comment on the companys relative financial strengths


1. Review the table of ratios provided with industry and sector comparisons. Highlight and discuss several key ratios. Comment on the companys relative financial strengths and weaknesses based on these comparisons.
Cornelius, Inc. (CRNI) Selected Valuation Ratios Company Industry Sector P/E Ratio (TTM) P/E High - Last 5 Yrs. P/E Low - Last 5 Yrs. 25.56 29.89 15.87 39.5 61.96 24.81 9.66 21.86 9.61 Beta 1.24 0.8 1.11 Price to Book (MRQ) Price to Cash Flow (TTM) 9.57 19.08 6.5 33.47 1.74 12.46 2.9 Dividend Yield Dividend Yield - 5 Year Avg Dividend 5 Year Growth Rate Payout Ratio (TTM) 1.72 2.25 13.14 40.62 1.52 1.56 10.79 38.61 1.42 31.51 21.38 Cornelius, Inc. (CRNI) Selected Financial Ratios 2014-06 2015-06 2016-06 2017-06 2018-06 TTM Company TTM Industry TTM Sector Profitability Ratios Tax Rate % Net Margin % Asset Turnover (Average) Return on Assets % Return on Equity % Return on invested Capital % Interest Coverage 20.65 25.42 0.55 14.02 26.17 21.79 47.6 34.12 13.03 0.54 7.00 14.36 11.16 24.7 14.95 19.69 0.46 9.08 22.09 14.81 16.89 8.40 23.57 0.41 9.75 29.37 16.36 11.42 54.57 15.02 0.44 6.63 21.37 11.21 14.35 51.39 16.38 0.45 7.43 21.43 11.95 15.15 27.89 9.11 0.71 8.78 14.95 12.45 10.87 25.06 17.48 0.81 13.74 17.89 13.8 10.74 Liquidity/Financial Health Current Ratio Quick Ratio Debt/Equity 2.5 2.31 0.23 2.5 2.3 0.35 2.35 2.22 0.57 2.48 2.37 1.05 2.9 2.74 0.87 2.92 2.72 0.81 1.94 3.08 0.30 1.87 2.31 0.17 Efficiency Payables Period Receivables Turnover Inventory Turnover Total Asset Turnover 83.07 4.69 11.72 0.55 77.46 5 11.88 0.54 75.1 4.72 12.72 0.46 76.11 4.73 15.46 0.41 76.17 4.77 15.84 0.44 70.19 7.19 11.72 0.45 32.18 8.25 42.56 0.71 45.62 6.98 15.79 0.81 Cornelius, Inc. (CRNI) Selected Valuation Ratios Company Industry Sector P/E Ratio (TTM) P/E High - Last 5 Yrs. P/E Low - Last 5 Yrs. 25.56 29.89 15.87 39.5 61.96 24.81 9.66 21.86 9.61 Beta 1.24 0.8 1.11 Price to Book (MRQ) Price to Cash Flow (TTM) 9.57 19.08 6.5 33.47 1.74 12.46 2.9 Dividend Yield Dividend Yield - 5 Year Avg Dividend 5 Year Growth Rate Payout Ratio (TTM) 1.72 2.25 13.14 40.62 1.52 1.56 10.79 38.61 1.42 31.51 21.38 Cornelius, Inc. (CRNI) Selected Financial Ratios 2014-06 2015-06 2016-06 2017-06 2018-06 TTM Company TTM Industry TTM Sector Profitability Ratios Tax Rate % Net Margin % Asset Turnover (Average) Return on Assets % Return on Equity % Return on invested Capital % Interest Coverage 20.65 25.42 0.55 14.02 26.17 21.79 47.6 34.12 13.03 0.54 7.00 14.36 11.16 24.7 14.95 19.69 0.46 9.08 22.09 14.81 16.89 8.40 23.57 0.41 9.75 29.37 16.36 11.42 54.57 15.02 0.44 6.63 21.37 11.21 14.35 51.39 16.38 0.45 7.43 21.43 11.95 15.15 27.89 9.11 0.71 8.78 14.95 12.45 10.87 25.06 17.48 0.81 13.74 17.89 13.8 10.74 Liquidity/Financial Health Current Ratio Quick Ratio Debt/Equity 2.5 2.31 0.23 2.5 2.3 0.35 2.35 2.22 0.57 2.48 2.37 1.05 2.9 2.74 0.87 2.92 2.72 0.81 1.94 3.08 0.30 1.87 2.31 0.17 Efficiency Payables Period Receivables Turnover Inventory Turnover Total Asset Turnover 83.07 4.69 11.72 0.55 77.46 5 11.88 0.54 75.1 4.72 12.72 0.46 76.11 4.73 15.46 0.41 76.17 4.77 15.84 0.44 70.19 7.19 11.72 0.45 32.18 8.25 42.56 0.71 45.62 6.98 15.79 0.81Step by Step Solution
There are 3 Steps involved in it
Step: 1

Get Instant Access to Expert-Tailored Solutions
See step-by-step solutions with expert insights and AI powered tools for academic success
Step: 2

Step: 3

Ace Your Homework with AI
Get the answers you need in no time with our AI-driven, step-by-step assistance
Get Started


