1. Romina is an oceanographer who recently obtained ocean temperature and ocean density data from the Labrador Sea using an argo float. Her colleague, Nico,
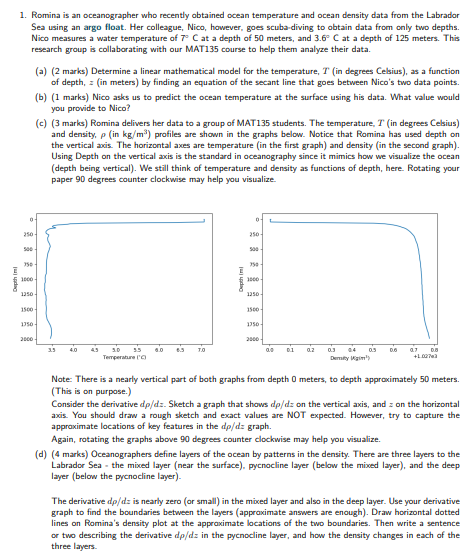
1. Romina is an oceanographer who recently obtained ocean temperature and ocean density data from the Labrador Sea using an argo float. Her colleague, Nico, however, goes scuba diving to obtain data from only two depths. Nico measures a water temperature of 7" Cat a depth of 50 meters, and 3.6" C at a depth of 125 meters. This research group is collaborating with our MAT135 course to help them analyze their data. (a) (2 marks) Determine a linear mathematical model for the temperature, I' (in degrees Celsius), as a function of depth, = (in meters) by finding an equation of the secant line that goes between Nico's two data points. (b) (1 marks) Nico asks us to predict the ocean temperature at the surface using his data. What value would you provide to Nico?' (c) (3 marks) Romina delivers her data to a group of MAT 135 students. The temperature, I' (in degrees Celsius) and density, p (in kg/m ) profiles are shown in the graphs below. Notice that Romina has used depth on the vertical axis. The horizontal axes are temperature (in the first graph) and density (in the second graph). Using Depth on the vertical axis is the standard in oceanography since it mimics how we visualize the ocean (depth being vertical). We still think of temperature and density as functions of depth, here. Rotating your paper 90 degrees counter clockwise may help you visualize. Depth Imi 1860 Cupthi 1340 1560 1350 1350 TO 0.2 14 09 [Dority Wain's +1 037 3 Note: There is a nearly vertical part of both graphs from depth 0 meters, to depth approximately 50 meters. (This is on purpose.) Consider the derivative dp/de. Sketch a graph that shows do/de on the vertical axis, and z on the horizontal axis. You should draw a rough sketch and exact values are NOT expected. However, try to capture the approximate locations of key features in the do/ds graph. Again, rotating the graphs above 90 degrees counter clockwise may help you visualize. (d) (4 marks) Oceanographers define layers of the ocean by patterns in the density. There are three layers to the Labrador Sea - the mixed layer (near the surface). pycnocline layer (below the mixed layer), and the deep layer (below the pycnocline layer)- The derivative dp/de is nearly zero (or small) in the mixed layer and also in the deep layer. Use your derivative graph to find the boundaries between the layers (approximate answers are enough). Draw horizontal dotted lines on Romina's density plot at the approximate locations of the two boundaries. Then write a sentence or two describing the derivative do/da in the pycnocline layer, and how the density changes in each of the three layers
Step by Step Solution
There are 3 Steps involved in it
Step: 1
Get Instant Access to Expert-Tailored Solutions
See step-by-step solutions with expert insights and AI powered tools for academic success
Step: 2
Step: 3
Ace Your Homework with AI
Get the answers you need in no time with our AI-driven, step-by-step assistance