

Question
1. Run a linear regression using artofstat. Direction is given below. (2 points) 1). Go to artofstat.com > Web Apps >Linear Regression (Links to an
1. Run a linear regression using artofstat. Direction is given below. (2 points)
1). Go to artofstat.com > Web Apps >Linear Regression
(Links to an external site.)
2). In the "Enter Data" drop down box select "Enter Own".
3). In the "Name of X-Variable:" box put the name of the variable you are analyzing.
4). In the "Name of Y-Variable:" box put Price.
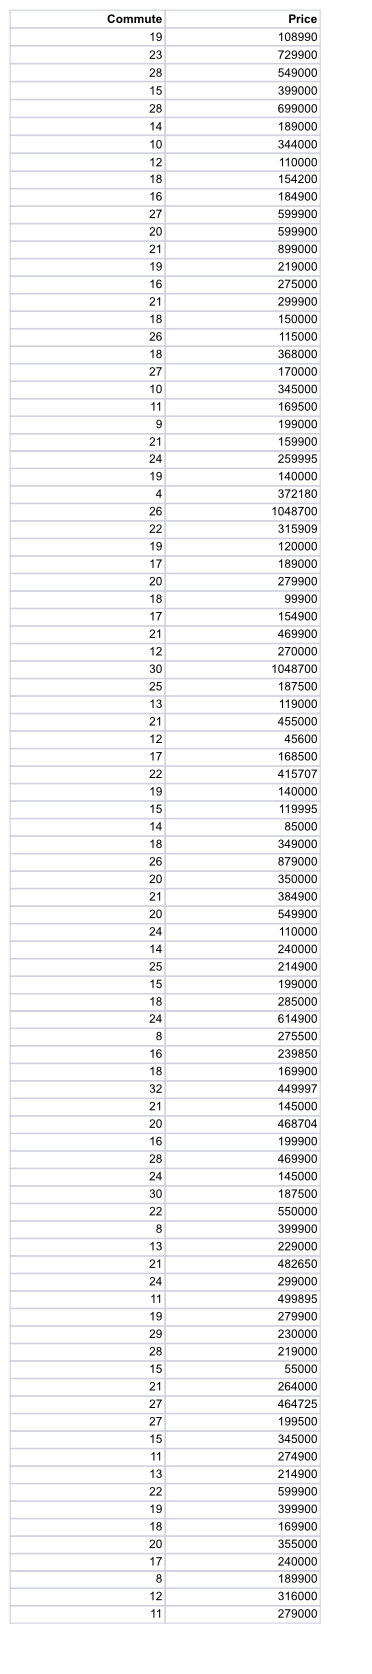
5). Copy and paste the data for the variable you are analyzing into the "xVar" column.
6). Copy and paste the data for Price into the "yVar" column.
7). In "Plot Options:" select "Regression Line". Click the red Submit Data button.
8). Taking a screenshot or use the snipping tool to copy the Scatterplot and Model Summary (found under the scatterplot) and paste them onto the document. (You can search how to take a screenshot using your computer online.)
2. Describe the scatterplot using the characteristics Directions, Outliers, Trend, Strength. (2 points)
3. What is the response variable? What is the predictor variable? (2 point)
4. State and interpret R-squared. (Use the value for R-Sq, not the R-Sq(adj).) (2 points)
5. State and interpret the correlation coefficient. (2 points)
6. Does this variable appear to be a good predictor of price? Explain your answer in a couple of sentences. Using the information found in the previous section to support your claim. Hint:Use information about the statistical concepts that you learned in the regression module and used in this project to justify your claim. (3 points)
Step by Step Solution
There are 3 Steps involved in it
Step: 1

Get Instant Access to Expert-Tailored Solutions
See step-by-step solutions with expert insights and AI powered tools for academic success
Step: 2

Step: 3
Ace Your Homework with AI
Get the answers you need in no time with our AI-driven, step-by-step assistance
Get Started