1.
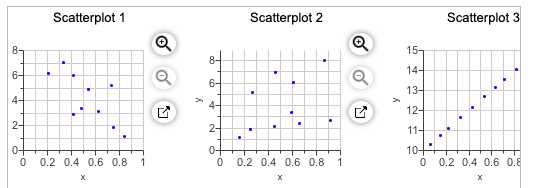
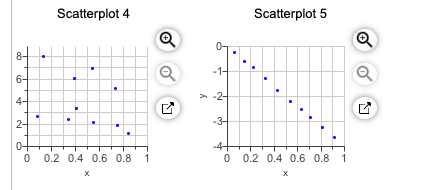
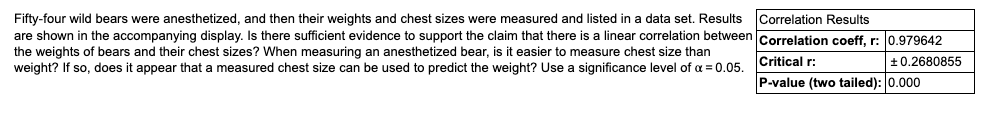
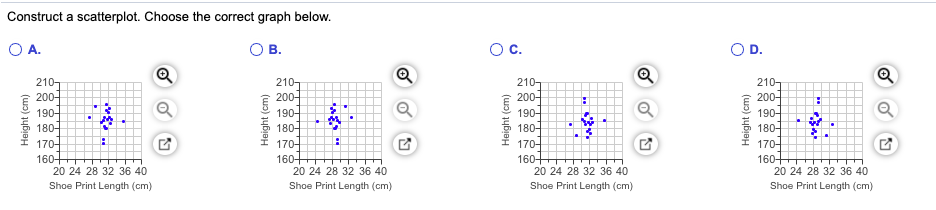
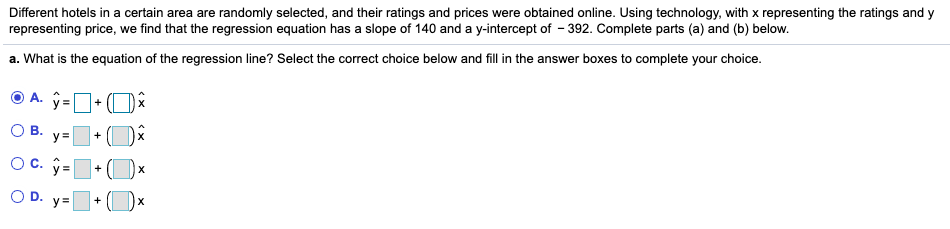
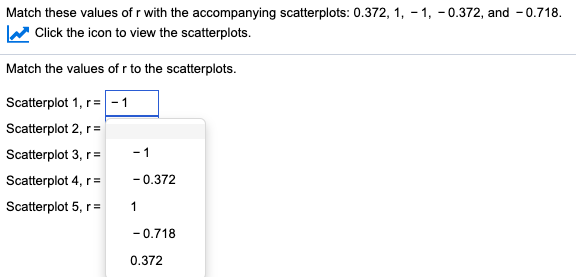
Scatterplot 1 Scatterplot 2 Scatterplot 3 15 8 6 6 a 14- 13- 4- J A 12- 2 2 11- # 0 0 10- 0 0.2 0.4 0.6 0.8 1 0 0.2 0.4 0.6 0.8 1 0 0.2 0.4 0.6 0.8Scatterplot 4 Scatterplot 5 O 3 -2- -3- 0 -4 0 0.2 0.4 0.6 0.8 1 0 0.2 0.4 0.6 0.8 1 XFifty-four wild bears were anesthetized, and then their weights and chest sizes were measured and listed in a data set. Results Correlation Results are shown in the accompanying display. Is there sufficient evidence to support the claim that there is a linear correlation between Correlation coeff, r: 0.979642 the weights of bears and their chest sizes? When measuring an anesthetized bear, is it easier to measure chest size than weight? If so, does it appear that a measured chest size can be used to predict the weight? Use a significance level of a = 0.05. Critical r: + 0.2680855 P-value (two tailed): 0.000Identify the correlation coefficient, r. rE Round to three decimal places as needed.)Construct a scatterplot. Choose the correct graph below. O A. OB. O C. OD. 210- 2107 210- 200- 2107 200- 200- 190- 200- 190- Height (cm) 190- Height (cm) 180- 190- Height (cm) 180- Height (cm) 180- 170- 180- 170- 170- 160- 170- 160- 20 24 28 32 36 40 160- 20 24 28 32 36 40 160- 20 24 28 32 36 40 Shoe Print Length (cm) 20 24 28 32 36 40 Shoe Print Length (cm) Shoe Print Length (cm) Shoe Print Length (cm)The linear correlation coefficient r is| (Round to three decimal places as needed.) Determine the null and alternative hypotheses. Ho: P H1 : P (Type integers or decimals. Do not round.) The linear correlation coefficient r is (Round to three decimal places as needed.) Determine the null and alternative hypotheses. Ho: P H1 : P (Type integers or decimals. Do not round.) The test statistic is (Round to two decimal places as needed.) The P-value is. (Round to three decimal places as needed.) Because the P-value of the linear correlation coefficient is the significance level, there sufficient evidence to support the claim that there is a linear correlation between shoe print lengths and heights of males.Different hotels in a certain area are randon'ly selected, and their ratings and prices were obtained online. Using technology, with 1 representing the ratings and 3 representing price. we nd that the regression equation has a slope of 140 and a yintercept of - 392. Complete parts (a) and {b} below. a. What is the equation of the regression liI'Ie'iI Select the correct choice below and ll in the answer boxes to complete your choice. m awn]: 0\" V=D+i A 0- awn: on. v=D+l b. What does the symbol y represent? O A. The symbol y represents the average price of hotels in the area. B. The symbol y represents the amount that price increases with a 1-point increase in ratingMatch these values of r with the accompanying scatterplots: 0.372, 1, - 1, - 0.372, and -0.718. Click the icon to view the scatterplots. Match the values of r to the scatterplots. Scatterplot 1, r= - 1 Scatterplot 2, r= Scatterplot 3, r= - 1 Scatterplot 4, r= - 0.372 Scatterplot 5, r= - - 0.718 0.372