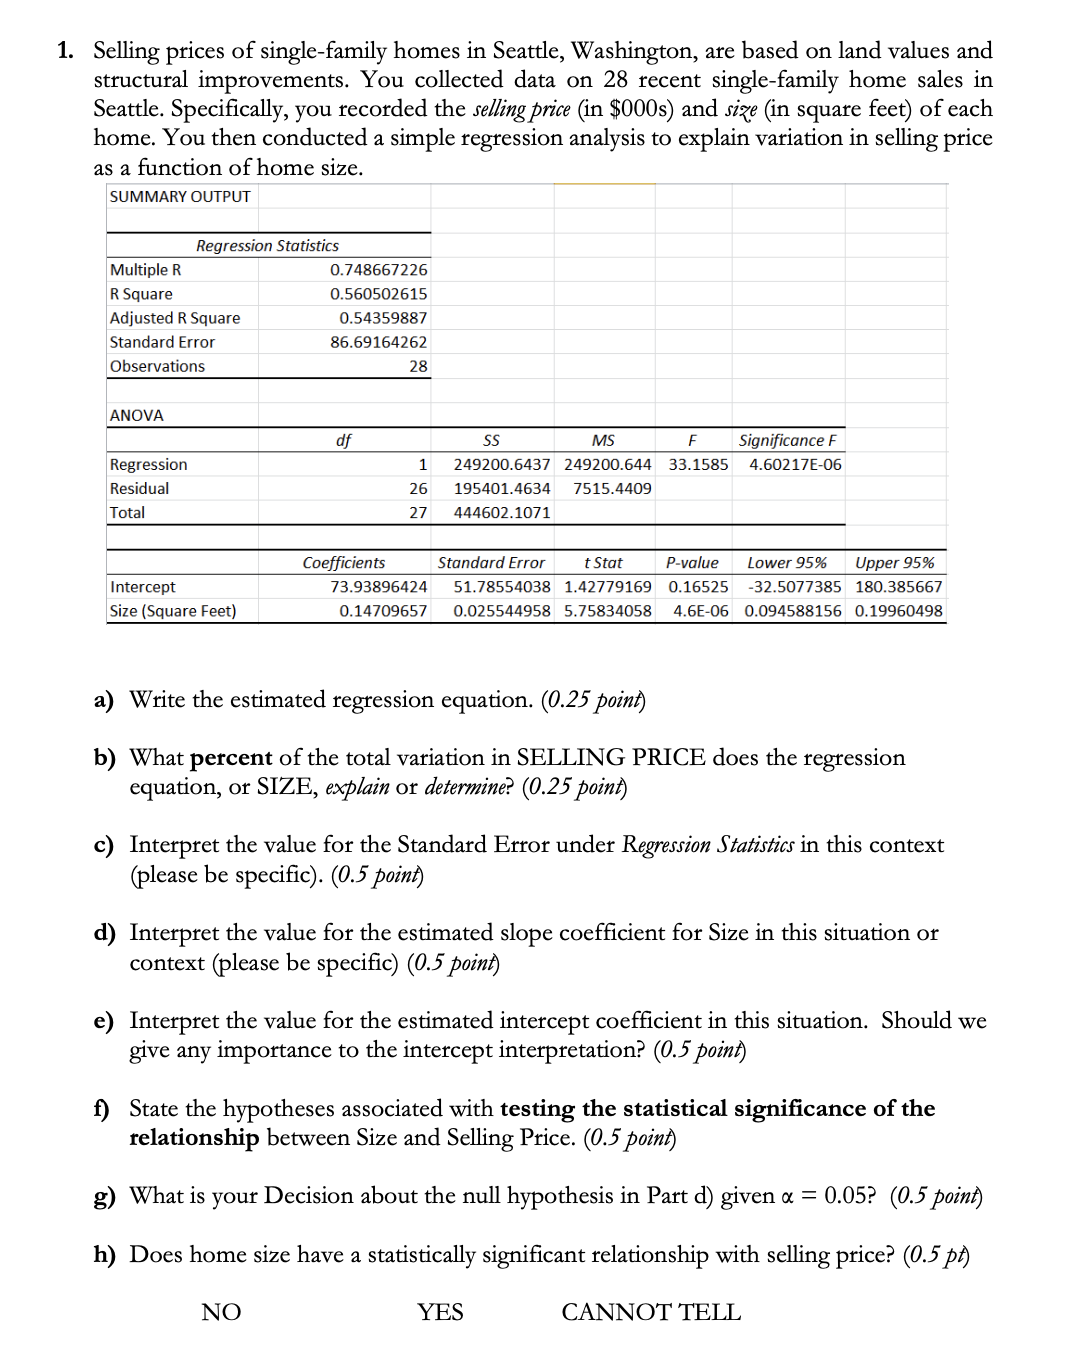
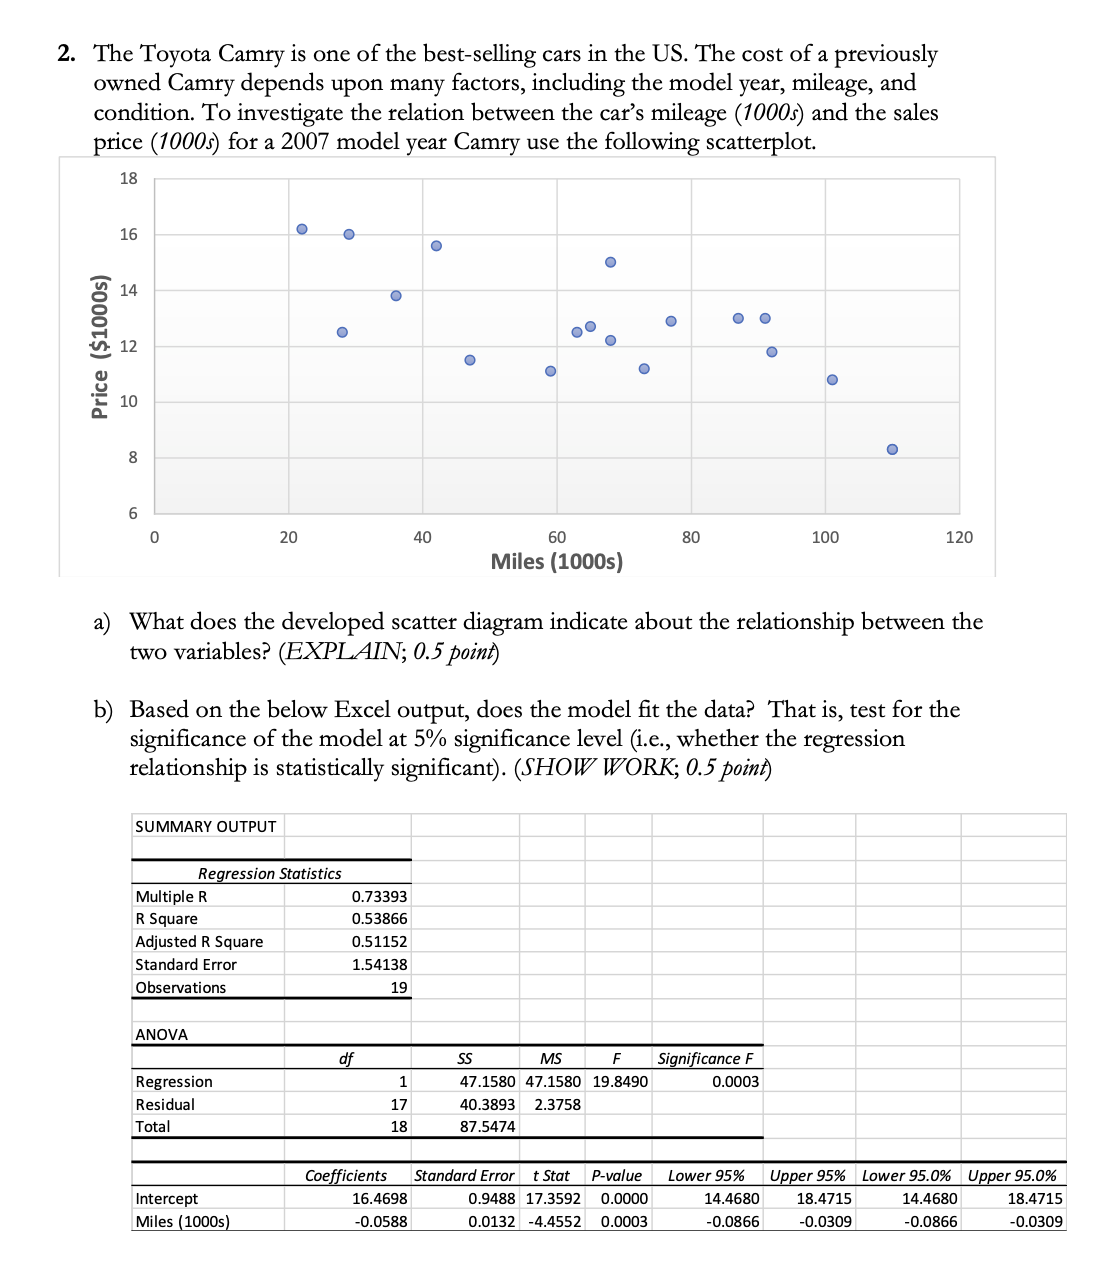
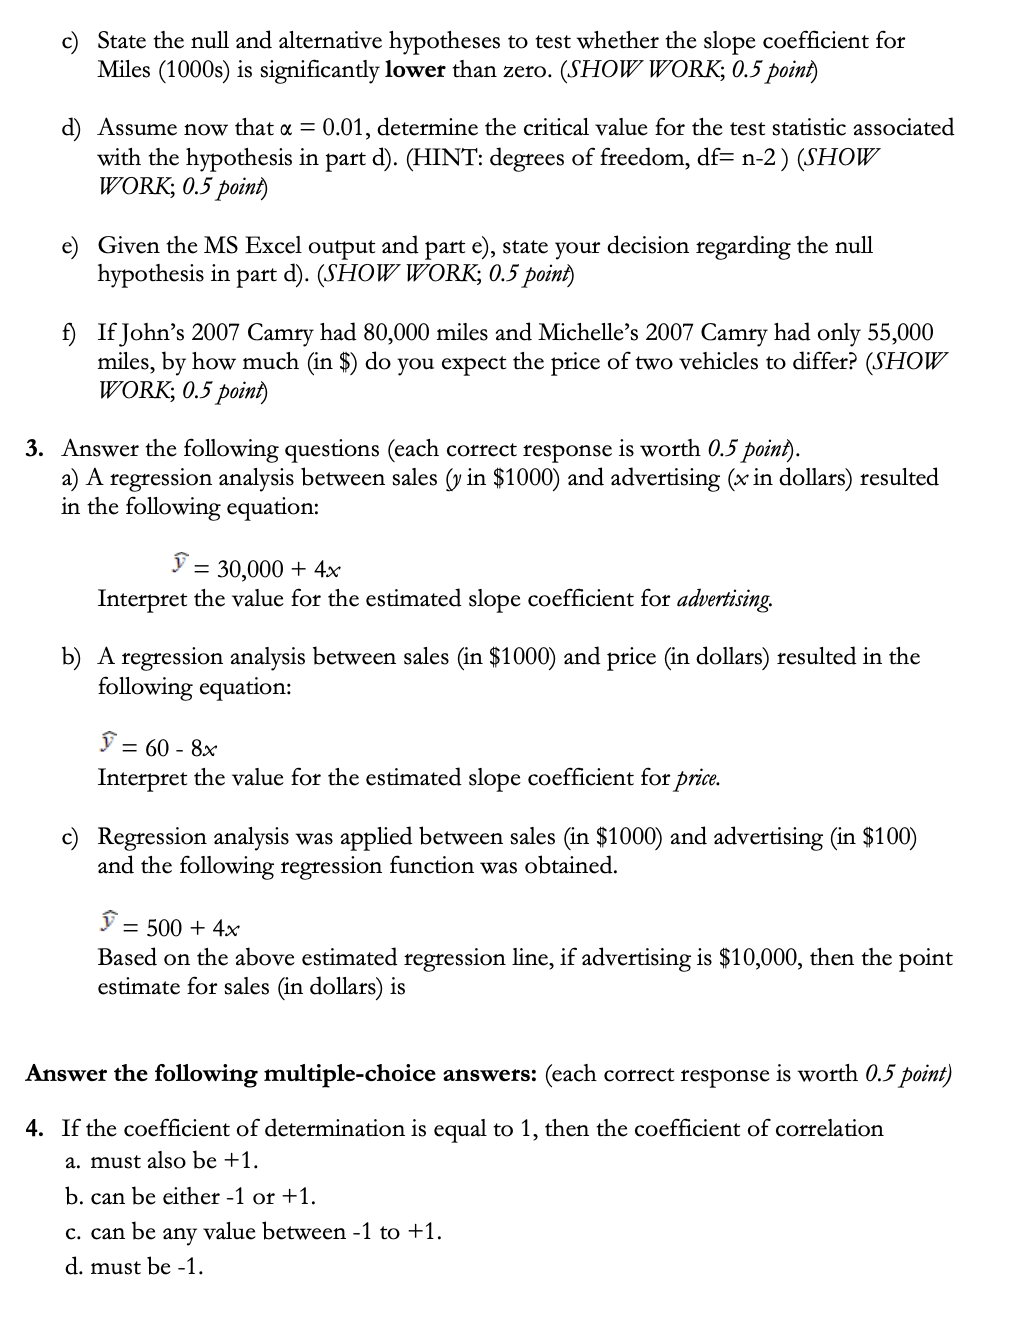
1. Selling prices of single-family homes in Seattle, Washington, are based on land values and structural improvements. You collected data on 28 recent single-family home sales in Seattle. Specifically, you recorded the selling price (in $000s) and size (in square feet) of each home. You then conducted a simple regression analysis to explain variation in selling price as a function of home size. SUMMARY OUTPUT Regression Statistics Multiple R 0.748667226 R Square 0.560502615 Adjusted R Square 0.54359887 Standard Error 86.69164262 Observations 28 ANOVA df SS MS F Significance F Regression 1 249200.6437 249200.644 33.1585 4.60217E-06 Residual 26 195401.4634 7515.4409 Total 27 444602.1071 Coefficients Standard Error t Stat P-value Lower 95% Upper 95% Intercept 73.93896424 51.78554038 1.42779169 0.16525 -32.5077385 180.385667 Size (Square Feet) 0.14709657 0.025544958 5.75834058 4.6E-06 0.094588156 0.19960498 a) Write the estimated regression equation. (0.25 point) b) What percent of the total variation in SELLING PRICE does the regression equation, or SIZE, explain or determine? (0.25 point) c) Interpret the value for the Standard Error under Regression Statistics in this context (please be specific). (0.5 point) d) Interpret the value for the estimated slope coefficient for Size in this situation or context (please be specific) (0.5 point) e) Interpret the value for the estimated intercept coefficient in this situation. Should we give any importance to the intercept interpretation? (0.5 point) f) State the hypotheses associated with testing the statistical significance of the relationship between Size and Selling Price. (0.5 point) g) What is your Decision about the null hypothesis in Part d) given a = 0.05? (0.5 point) h) Does home size have a statistically significant relationship with selling price? (0.5 pf) NO YES CANNOT TELL2. The Toyota Camry is one of the best-selling cars in the US. The cost of a previously owned Camry depends upon many factors, including the model year, mileage, and condition. To investigate the relation between the car's mileage (1000s) and the sales price (1000s) for a 2007 model year Camry use the following scatterplot. 18 16 14 O C O O Price ($1000s) 12 10 00 20 40 60 80 100 120 Miles (1000s) a) What does the developed scatter diagram indicate about the relationship between the two variables? (EXPLAIN; 0.5 point) b) Based on the below Excel output, does the model fit the data? That is, test for the significance of the model at 5% significance level (i.e., whether the regression relationship is statistically significant). (SHOW WORK; 0.5 point) SUMMARY OUTPUT Regression Statistics Multiple R 0.73393 R Square 0.53866 Adjusted R Square 0.51152 Standard Error 1.54138 Observations 19 ANOVA df SS MS Significance F Regression 1 47.1580 47.1580 19.8490 0.0003 Residual 17 40.3893 2.3758 Tota 18 87.5474 Coefficients Standard Error |t Stat P-value Lower 95% Upper 95% Lower 95.0% Upper 95.0% Intercept 16.4698 0.9488 17.3592 0.0000 14.4680 18.4715 14.4680 18.4715 Miles (1000s) -0.0588 0.0132 -4.4552 0.0003 -0.0866 -0.0309 -0.0866 -0.0309c) State the null and alternative hypotheses to test whether the slope coefficient for Miles (1000s) is significantly lower than zero. (SHOW WORK; 0.5 point) d) Assume now that a = 0.01, determine the critical value for the test statistic associated with the hypothesis in part d). (HINT: degrees of freedom, df= n-2 ) (SHOW WORK; 0.5 point) e) Given the MS Excel output and part e), state your decision regarding the null hypothesis in part d). (SHOW WORK; 0.5 point) f) If John's 2007 Camry had 80,000 miles and Michelle's 2007 Camry had only 55,000 miles, by how much (in $) do you expect the price of two vehicles to differ? (SHOW WORK; 0.5 point) 3. Answer the following questions (each correct response is worth 0.5 point). a) A regression analysis between sales (y in $1000) and advertising (x in dollars) resulted in the following equation: = 30,000 + 4x Interpret the value for the estimated slope coefficient for advertising. b) A regression analysis between sales (in $1000) and price (in dollars) resulted in the following equation: J = 60 - 8x Interpret the value for the estimated slope coefficient for price. c) Regression analysis was applied between sales (in $1000) and advertising (in $100) and the following regression function was obtained. = 500 + 4x Based on the above estimated regression line, if advertising is $10,000, then the point estimate for sales (in dollars) is Answer the following multiple-choice answers: (each correct response is worth 0.5 point) 4. If the coefficient of determination is equal to 1, then the coefficient of correlation a. must also be +1. b. can be either -1 or +1. c. can be any value between -1 to +1. d. must be -1.5. If the coefcient of correlation is .4, then the slope of the regression line a. must also be -.4. b. can be either negative or positive. c. must be negative. d. must be .16. 6. If variables, x and j, have a strong linear relationship, then a. there may or may not be any causal relationship between x and y. b. x causes y to happen. c. y causes x to happen. d. the F test is used to conclude there is a causal relationship between at and j. 7. In regression analysis, if the dependent variable is measured in dollars, the independent variable a. must also be in dollars. b. must be in some units of currency. c. can be measured in any units. d. cannot be in dollars