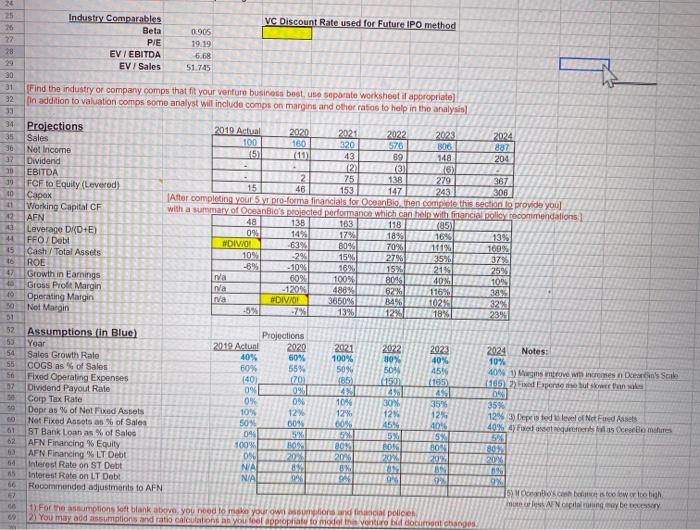
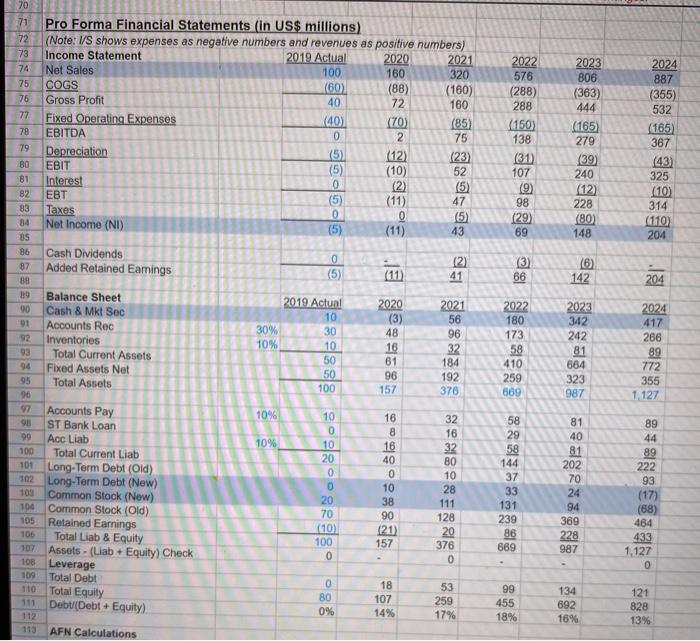
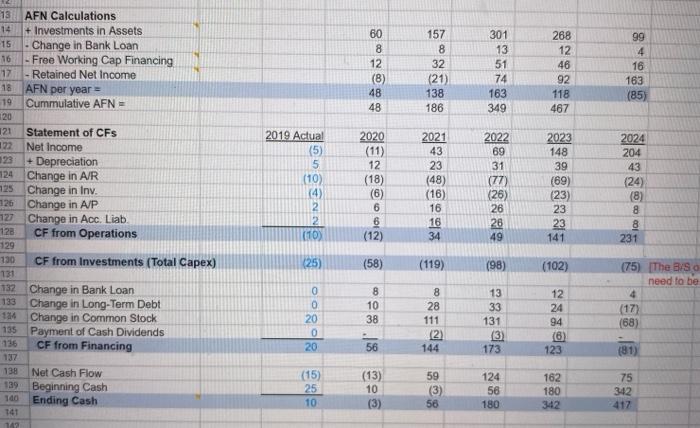
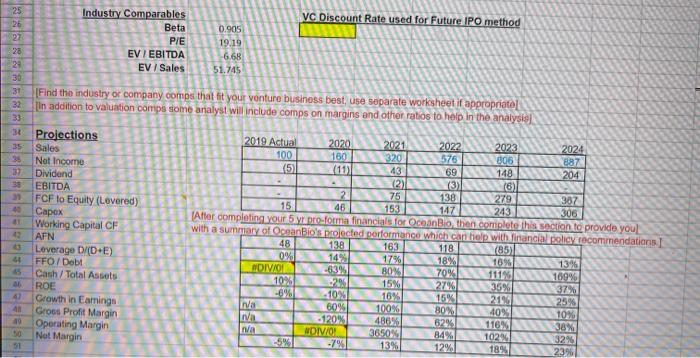
1. should the founders move ahead with this business opportunity and why in terms of growth drivers, market size, and profit potential?
25 VC Discount Rate used for Future IPO method 26 Industry Comparables Beta P/E EV / EBITDA EV / Sales 0905 19.19 5.58 51.745 Find the industry or company comps that fit your venture business best use separate worksheet il appropriate) [in addition to valuation comps some analyst will include comps on margins and other ratios to help in the analysis 28 20 30 31 32 33 34 35 36 37 20 10 2024 10 11 12 Projections Sales Net Income Dividend EBITDA FCF to Equity (Levered) Capox Working Capital CF AFN Leverage D D+E) FFO/ Debt Cash/Total Assets ROE Growth in Earnings Gross Profit Margin Operating Margin Net Margin 2019 Actual 2020 2021 2022 2023 100 160 320 576 B06 882 15) 43 89 148 204 ( 236) 2 25138 279 367 15 46 1531471243308 After completing your 5 y pro forma financials for OceanBig, then complete this section to provide you with a summary of OceanBiospected performance which can help with financial policy recommendations 48 138 163 118 (85) 0% 14% 17% 1895116% 13% #DIVAO 6394 80% 7096 101% 109% 10% 29 27% 3526 37% -69% -10% 16%, 15% 21% 25% Ina 60% 100% 20461 40 10% nia -12095 62% 11638% na DIVIO! 3650 B4% 02% 32% -5% -7% 13% 12 2321 4 15 16 47 10 50 01 193 53 54 56 56 57 2022 30% 50% 2024 Notes: 10% 40% Mugs mrowe w incremes Dean's Scale 1195, Feder but we than 150 Assumptions in Blue) Year Sales Growth Rale COGS as of Sales Fixed Operating Expenses Dividend Payout Rate Corp Tax Rate Depr as of Net Fixed Assets Not Fixed Assotsas of Sales ST Bank Loan as % of Sales AFN Financing % Equity AFN Financing % LT Debt Interest Rate on ST Debt Interest Rate on LT Debt Recommended adjustments to AFN Projections 2019 Actual 2020 2021 40% 60% 100% 60% 55% 50% 140) 170 105 09 0% OX 0 10% 10% 12% 12% 50% 009 00% 044 5% 100% 80% 80% 0% 20RON NA 8 BN NIA BERRIA 2923 40% 45 (185 46 3596 12% 40 5% BON 2012 24 30% 12% 454 5% BOG 20 60 61 62 35% 129) Depisted steel of Net Fred Assets 40% Fotostrecurrents us OceBo more 5 80% 54 20 60 22 OX 5) Woonosch bis high Folloin may be boy 1) For the motions loft blank above, you need to make your own mind and final police 2) You may add assumptions and ratio calculations as you to propriate to model this venture bidocoat changes 2022 576 (288) 288 (150) 138 (31) 107 (9 98 (29) 69 2023 806 (363) 444 (165 279 (39) 240 (12) 228 (80) 148 2024 887 (355) 532 (165 367 (43) 325 (10) 314 (110) 204 (3) 66 (6) 142 204 70 71 Pro Forma Financial Statements (in US$ millions) 72 (Note: I/S shows expenses as negative numbers and revenues as positive numbers) 73 Income Statement 2019 Actual 2020 2021 74 Net Sales 100 160 320 75 COGS (60) (88) (160) 76 Gross Profit 40 72 160 77 Fixed Operating Expenses (40) (70) (85 78 EBITDA 0 2 75 79 Depreciation (5) (12) (23) BO EBIT (5) (10) 52 81 Interest 0 (2) (5) B2 EBT (5) (11) 47 83 Taxes 0 9 (5) 34 Net Income (NI) (5) (11) 43 BS 86 Cash Dividends 0 (2) 87 Added Retained Eamings (5) (11) 41 88 9 Balance Sheet 2019 Actual 2020 2021 90 Cash & Mkt Sec 10 (3) 56 91 Accounts Rec 30% 30 48 96 92 Inventories 10% 10 16 32 Total Current Assets 50 61 184 94 Fixed Assets Net 50 96 192 95 Total Assets 100 157 370 96 97 Accounts Pay 10% 10 16 32 ST Bank Loan 0 8 16 99 Acc Liab 10% 10 100 16 Total Current Liab 32 20 40 80 101 Long-Term Debt (Old) 0 0 10 102 Long-Term Debt (New) 0 28 103 Common Stock (New) 20 38 104 111 Common Stock (Old) 70 90 128 105 Retained Earnings (10) 121 20 106 Total Liab & Equity 100 157 376 107 Assets - (Liab + Equity) Check 0 0 108 Leverage 109 Total Debt 0 18 53 100 80 111 107 Debul(Debt. Equity). 259 0% 14% 17% 113 AFN Calculations 2022 180 173 58 410 259 689 2023 342 242 81 664 323 987 2024 417 266 89 772 355 1 127 58 29 58 144 37 33 131 239 86 669 10 81 40 81 202 70 24 94 369 228 987 89 44 89 222 93 (17) (68) 484 433 1,127 0 Total Equity 99 455 18% 134 692 16% 121 828 13% 112 60 8 12 (8) 48 48 157 8 32 (21) 138 186 301 13 51 74 163 268 12 46 92 118 467 99 4 16 163 (85) 349 2020 13. AFN Calculations + Investments in Assets -15 - Change in Bank Loan 16 - Free Working Cap Financing 17 - Retained Net Income 18 AFN per year 19 Cummulative AFN = 120 121 Statement of CFs 122 Net income 23 + Depreciation 124 Change in AIR 25 Change in Inv. 126 Change in A/P 127 Change in Acc. Liab 128 CF from Operations 129 130 CF from Investments (Total Capex) 731 132 Change in Bank Loan 133 Change in Long-Term Debt 184 Change in Common Stock 135 Payment of Cash Dividends 136 CF from Financing 2019 Actual (5) 5 (10) (4) 2 2 (10) 12 (18) (6) 6 6 (12) 2021 43 23 (48) (16) 16 16 34 2022 69 31 (77) (26) 26 26 49 2023 148 39 (69) (23) 23 23 141 2024 204 43 (24) (8) 8 8 231 (25) (58) (119) (98) (102) 0 0 20 0 20 8 10 38 8 28 111 (2) 144 13 33 131 3) 173 12 24 94 (75) The B/89 need to be 4 (17) (68) 56 123 (81) 59 138 Net Cash Flow 139 Beginning Cash 100 Ending Cash 141 142 (15) 25 10 (13) 10 124 56 180 162 180 342 75 342 417 56 VC Discount Rate used for Future IPO method 25 26 27 28 22 30 31 32 33 Industry Comparables Beta PIE EV / EBITDA EV / Sales 0.905 19.19 6.68 51.745 [Find the industry or company comps that fit your venture business best, use separate worksheet if appropriate In addition to valuation comps some analyst will include comps on margins and other ratos to help in the analysis 35 39 37 38 243 42 Projections Sales Not Income Dividend EBITDA FCF lo Equity (Levered) Capex Working Capital CF AFN Leverage D/( DE) FFO/ Debt Cash/Total Assets ROE Growth in Earnings Gross Profit Margin Operating Margin Not Margin 2019 Actual 2020 2021 2022 2023 2024 100 160 320 576 806 887 (5 (11) 43 69 148 204 (2) (6) 2 75 138 279 387 15 46 153 147 306 After completing your 5 yr proforma financials for OceanBo then complete this section to provide you! with a summary of Ocean Bio's projected performance which can help with financial policy recommendations 48 138 163 118 (85) 0% 17% 18% 10% 1396 HOIVAO -63% B0% 70%) 111% 109% 10% 29 15% 27% 35% 37% -6% -10 16% 15% 2196 na 25% 6091 100% 80 40% wa 10% -120% 486% 62% 116% 38% n/a DIVO! 84% 1024 32% -7% 13% 12% 18% 23% 42 AN 51 50 55 56 57 50 Se 0% 09 12% Assumptions in Blue) Projections Year 2019 Actual 2020 2021 2022 2023 2024 Notes: Sales Growth Rate 40% 50% 100% B0% 40% 10% COGS as of Sales 60% 55% 50% 50% 45% 40% 1) Margins prove with increases in Oond's Son Fixed Operating Expenses (40) 170) (85 (860) (165 (165) 2) Fixed Expenses but slower than a Dividend Payout Rale 0% 49 49 0% Corp Tax Rate 0% 10% 30% 35% 35% Dept as of Not Fixed Assets 10% 12% 12% 12% 12% 3) Capris led to be of Net Food Assets Net Food Assets as of Sales 50% 60% 40% 40%) Fondant requirements foils Oormats ST Bank Loan as % of Sales 09 5% 5% 5% 55 AFN Financing % Equity 100% 8046 809808080% AFN Financing XLT Debt 0% 2016 20% 20%20%20% Interest Rate on ST Debt NIA BX 89% 8% BS 8% Interest Rate on LT Debt N/A 9% 9% 9% 99 9 Recommended adjustments to AFN 5. Oceli's cash balance a loo lowo Bagh 1) For the assumptions of blank above, you need to make your own assumptions and financial policies more on AFN coas may besar 2) You may add assumptions and ratio ealeulations as you feel appropriate to model this venture but document changes 04 65 19 1 2 3 4 OceanBio Corporation Company Description Five year old Hawaii ocean plant based pharmaceutical company OceanBio has 2 promising drugs that are in phase III of FDA approval The Biopharmaceutical industry is experiencing approximately 13% annual growth worldwide. OceanBio Corp equity is 100% owned by one founder. To finance growth and R&D, OceanBio Corp is looking to raise significant capital (debt or equity) over the next few years. OceanBio's founder has hired you as an advisor for raising additional capital from VC funds and banks. 5 6 7 8 9 25 VC Discount Rate used for Future IPO method 26 Industry Comparables Beta P/E EV / EBITDA EV / Sales 0905 19.19 5.58 51.745 Find the industry or company comps that fit your venture business best use separate worksheet il appropriate) [in addition to valuation comps some analyst will include comps on margins and other ratios to help in the analysis 28 20 30 31 32 33 34 35 36 37 20 10 2024 10 11 12 Projections Sales Net Income Dividend EBITDA FCF to Equity (Levered) Capox Working Capital CF AFN Leverage D D+E) FFO/ Debt Cash/Total Assets ROE Growth in Earnings Gross Profit Margin Operating Margin Net Margin 2019 Actual 2020 2021 2022 2023 100 160 320 576 B06 882 15) 43 89 148 204 ( 236) 2 25138 279 367 15 46 1531471243308 After completing your 5 y pro forma financials for OceanBig, then complete this section to provide you with a summary of OceanBiospected performance which can help with financial policy recommendations 48 138 163 118 (85) 0% 14% 17% 1895116% 13% #DIVAO 6394 80% 7096 101% 109% 10% 29 27% 3526 37% -69% -10% 16%, 15% 21% 25% Ina 60% 100% 20461 40 10% nia -12095 62% 11638% na DIVIO! 3650 B4% 02% 32% -5% -7% 13% 12 2321 4 15 16 47 10 50 01 193 53 54 56 56 57 2022 30% 50% 2024 Notes: 10% 40% Mugs mrowe w incremes Dean's Scale 1195, Feder but we than 150 Assumptions in Blue) Year Sales Growth Rale COGS as of Sales Fixed Operating Expenses Dividend Payout Rate Corp Tax Rate Depr as of Net Fixed Assets Not Fixed Assotsas of Sales ST Bank Loan as % of Sales AFN Financing % Equity AFN Financing % LT Debt Interest Rate on ST Debt Interest Rate on LT Debt Recommended adjustments to AFN Projections 2019 Actual 2020 2021 40% 60% 100% 60% 55% 50% 140) 170 105 09 0% OX 0 10% 10% 12% 12% 50% 009 00% 044 5% 100% 80% 80% 0% 20RON NA 8 BN NIA BERRIA 2923 40% 45 (185 46 3596 12% 40 5% BON 2012 24 30% 12% 454 5% BOG 20 60 61 62 35% 129) Depisted steel of Net Fred Assets 40% Fotostrecurrents us OceBo more 5 80% 54 20 60 22 OX 5) Woonosch bis high Folloin may be boy 1) For the motions loft blank above, you need to make your own mind and final police 2) You may add assumptions and ratio calculations as you to propriate to model this venture bidocoat changes 2022 576 (288) 288 (150) 138 (31) 107 (9 98 (29) 69 2023 806 (363) 444 (165 279 (39) 240 (12) 228 (80) 148 2024 887 (355) 532 (165 367 (43) 325 (10) 314 (110) 204 (3) 66 (6) 142 204 70 71 Pro Forma Financial Statements (in US$ millions) 72 (Note: I/S shows expenses as negative numbers and revenues as positive numbers) 73 Income Statement 2019 Actual 2020 2021 74 Net Sales 100 160 320 75 COGS (60) (88) (160) 76 Gross Profit 40 72 160 77 Fixed Operating Expenses (40) (70) (85 78 EBITDA 0 2 75 79 Depreciation (5) (12) (23) BO EBIT (5) (10) 52 81 Interest 0 (2) (5) B2 EBT (5) (11) 47 83 Taxes 0 9 (5) 34 Net Income (NI) (5) (11) 43 BS 86 Cash Dividends 0 (2) 87 Added Retained Eamings (5) (11) 41 88 9 Balance Sheet 2019 Actual 2020 2021 90 Cash & Mkt Sec 10 (3) 56 91 Accounts Rec 30% 30 48 96 92 Inventories 10% 10 16 32 Total Current Assets 50 61 184 94 Fixed Assets Net 50 96 192 95 Total Assets 100 157 370 96 97 Accounts Pay 10% 10 16 32 ST Bank Loan 0 8 16 99 Acc Liab 10% 10 100 16 Total Current Liab 32 20 40 80 101 Long-Term Debt (Old) 0 0 10 102 Long-Term Debt (New) 0 28 103 Common Stock (New) 20 38 104 111 Common Stock (Old) 70 90 128 105 Retained Earnings (10) 121 20 106 Total Liab & Equity 100 157 376 107 Assets - (Liab + Equity) Check 0 0 108 Leverage 109 Total Debt 0 18 53 100 80 111 107 Debul(Debt. Equity). 259 0% 14% 17% 113 AFN Calculations 2022 180 173 58 410 259 689 2023 342 242 81 664 323 987 2024 417 266 89 772 355 1 127 58 29 58 144 37 33 131 239 86 669 10 81 40 81 202 70 24 94 369 228 987 89 44 89 222 93 (17) (68) 484 433 1,127 0 Total Equity 99 455 18% 134 692 16% 121 828 13% 112 60 8 12 (8) 48 48 157 8 32 (21) 138 186 301 13 51 74 163 268 12 46 92 118 467 99 4 16 163 (85) 349 2020 13. AFN Calculations + Investments in Assets -15 - Change in Bank Loan 16 - Free Working Cap Financing 17 - Retained Net Income 18 AFN per year 19 Cummulative AFN = 120 121 Statement of CFs 122 Net income 23 + Depreciation 124 Change in AIR 25 Change in Inv. 126 Change in A/P 127 Change in Acc. Liab 128 CF from Operations 129 130 CF from Investments (Total Capex) 731 132 Change in Bank Loan 133 Change in Long-Term Debt 184 Change in Common Stock 135 Payment of Cash Dividends 136 CF from Financing 2019 Actual (5) 5 (10) (4) 2 2 (10) 12 (18) (6) 6 6 (12) 2021 43 23 (48) (16) 16 16 34 2022 69 31 (77) (26) 26 26 49 2023 148 39 (69) (23) 23 23 141 2024 204 43 (24) (8) 8 8 231 (25) (58) (119) (98) (102) 0 0 20 0 20 8 10 38 8 28 111 (2) 144 13 33 131 3) 173 12 24 94 (75) The B/89 need to be 4 (17) (68) 56 123 (81) 59 138 Net Cash Flow 139 Beginning Cash 100 Ending Cash 141 142 (15) 25 10 (13) 10 124 56 180 162 180 342 75 342 417 56 VC Discount Rate used for Future IPO method 25 26 27 28 22 30 31 32 33 Industry Comparables Beta PIE EV / EBITDA EV / Sales 0.905 19.19 6.68 51.745 [Find the industry or company comps that fit your venture business best, use separate worksheet if appropriate In addition to valuation comps some analyst will include comps on margins and other ratos to help in the analysis 35 39 37 38 243 42 Projections Sales Not Income Dividend EBITDA FCF lo Equity (Levered) Capex Working Capital CF AFN Leverage D/( DE) FFO/ Debt Cash/Total Assets ROE Growth in Earnings Gross Profit Margin Operating Margin Not Margin 2019 Actual 2020 2021 2022 2023 2024 100 160 320 576 806 887 (5 (11) 43 69 148 204 (2) (6) 2 75 138 279 387 15 46 153 147 306 After completing your 5 yr proforma financials for OceanBo then complete this section to provide you! with a summary of Ocean Bio's projected performance which can help with financial policy recommendations 48 138 163 118 (85) 0% 17% 18% 10% 1396 HOIVAO -63% B0% 70%) 111% 109% 10% 29 15% 27% 35% 37% -6% -10 16% 15% 2196 na 25% 6091 100% 80 40% wa 10% -120% 486% 62% 116% 38% n/a DIVO! 84% 1024 32% -7% 13% 12% 18% 23% 42 AN 51 50 55 56 57 50 Se 0% 09 12% Assumptions in Blue) Projections Year 2019 Actual 2020 2021 2022 2023 2024 Notes: Sales Growth Rate 40% 50% 100% B0% 40% 10% COGS as of Sales 60% 55% 50% 50% 45% 40% 1) Margins prove with increases in Oond's Son Fixed Operating Expenses (40) 170) (85 (860) (165 (165) 2) Fixed Expenses but slower than a Dividend Payout Rale 0% 49 49 0% Corp Tax Rate 0% 10% 30% 35% 35% Dept as of Not Fixed Assets 10% 12% 12% 12% 12% 3) Capris led to be of Net Food Assets Net Food Assets as of Sales 50% 60% 40% 40%) Fondant requirements foils Oormats ST Bank Loan as % of Sales 09 5% 5% 5% 55 AFN Financing % Equity 100% 8046 809808080% AFN Financing XLT Debt 0% 2016 20% 20%20%20% Interest Rate on ST Debt NIA BX 89% 8% BS 8% Interest Rate on LT Debt N/A 9% 9% 9% 99 9 Recommended adjustments to AFN 5. Oceli's cash balance a loo lowo Bagh 1) For the assumptions of blank above, you need to make your own assumptions and financial policies more on AFN coas may besar 2) You may add assumptions and ratio ealeulations as you feel appropriate to model this venture but document changes 04 65 19 1 2 3 4 OceanBio Corporation Company Description Five year old Hawaii ocean plant based pharmaceutical company OceanBio has 2 promising drugs that are in phase III of FDA approval The Biopharmaceutical industry is experiencing approximately 13% annual growth worldwide. OceanBio Corp equity is 100% owned by one founder. To finance growth and R&D, OceanBio Corp is looking to raise significant capital (debt or equity) over the next few years. OceanBio's founder has hired you as an advisor for raising additional capital from VC funds and banks. 5 6 7 8 9
