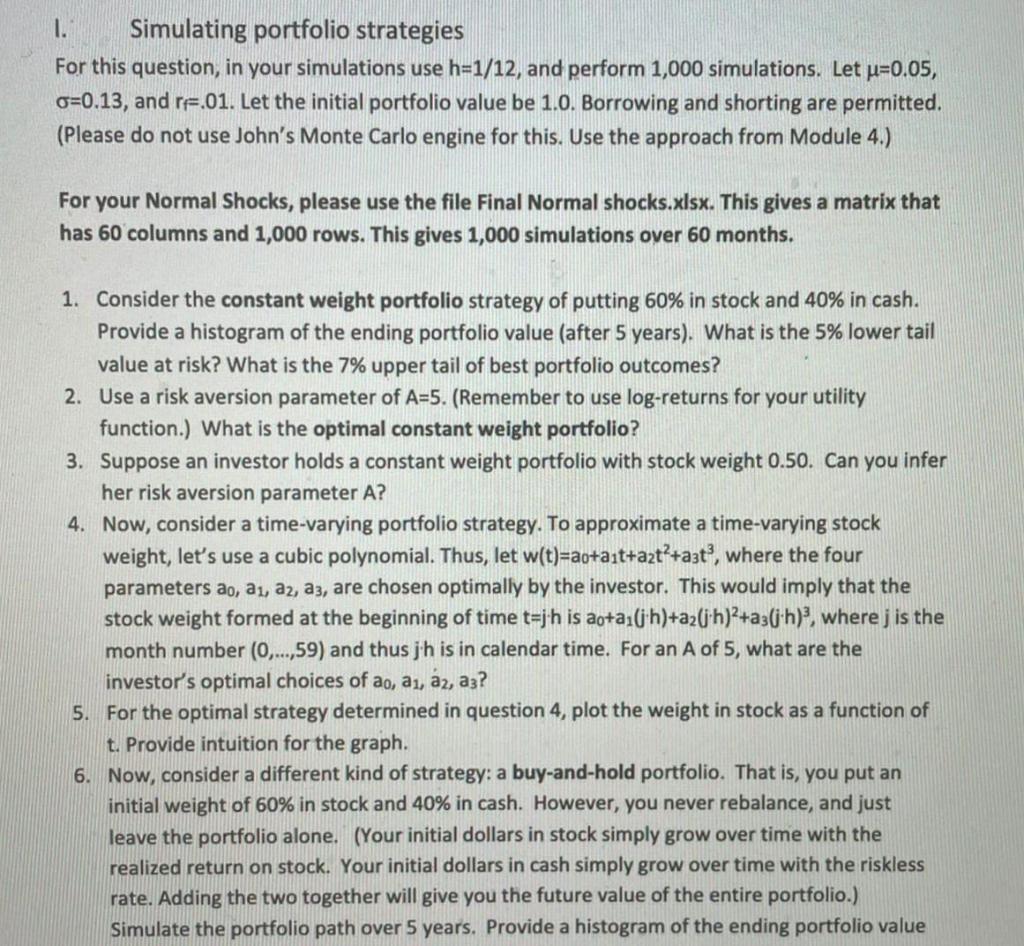
1. Simulating portfolio strategies For this question, in your simulations use h=1/12, and perform 1,000 simulations. Let u=0.05, 0=0.13, and rf.01. Let the initial portfolio value be 1.0. Borrowing and shorting are permitted. (Please do not use John's Monte Carlo engine for this. Use the approach from Module 4.) For your Normal Shocks, please use the file Final Normal shocks.xlsx. This gives a matrix that has 60 columns and 1,000 rows. This gives 1,000 simulations over 60 months. 1. Consider the constant weight portfolio strategy of putting 60% in stock and 40% in cash. Provide a histogram of the ending portfolio value (after 5 years). What is the 5% lower tail value at risk? What is the 7% upper tail of best portfolio outcomes? 2. Use a risk aversion parameter of A=5. (Remember to use log-returns for your utility function.) What is the optimal constant weight portfolio? 3. Suppose an investor holds a constant weight portfolio with stock weight 0.50. Can you infer her risk aversion parameter A? 4. Now, consider a time-varying portfolio strategy. To approximate a time-varying stock weight, let's use a cubic polynomial. Thus, let w(t)=ao+ait+at+azt, where the four parameters ao, ai, az, az, are chosen optimally by the investor. This would imply that the stock weight formed at the beginning of time t=jh is ao+a1(jh)+22[j+h)2+a; (jh), where; is the month number (0,...,59) and thus jh is in calendar time. For an A of 5, what are the investor's optimal choices of ao, ai, az, az? 5. For the optimal strategy determined in question 4, plot the weight in stock as a function of t. Provide intuition for the graph. 6. Now, consider a different kind of strategy: a buy-and-hold portfolio. That is, you put an initial weight of 60% in stock and 40% in cash. However, you never rebalance, and just leave the portfolio alone. (Your initial dollars in stock simply grow over time with the realized return on stock. Your initial dollars in cash simply grow over time with the riskless rate. Adding the two together will give you the future value of the entire portfolio.) Simulate the portfolio path over 5 years. Provide a histogram of the ending portfolio value 1. Simulating portfolio strategies For this question, in your simulations use h=1/12, and perform 1,000 simulations. Let u=0.05, 0=0.13, and rf.01. Let the initial portfolio value be 1.0. Borrowing and shorting are permitted. (Please do not use John's Monte Carlo engine for this. Use the approach from Module 4.) For your Normal Shocks, please use the file Final Normal shocks.xlsx. This gives a matrix that has 60 columns and 1,000 rows. This gives 1,000 simulations over 60 months. 1. Consider the constant weight portfolio strategy of putting 60% in stock and 40% in cash. Provide a histogram of the ending portfolio value (after 5 years). What is the 5% lower tail value at risk? What is the 7% upper tail of best portfolio outcomes? 2. Use a risk aversion parameter of A=5. (Remember to use log-returns for your utility function.) What is the optimal constant weight portfolio? 3. Suppose an investor holds a constant weight portfolio with stock weight 0.50. Can you infer her risk aversion parameter A? 4. Now, consider a time-varying portfolio strategy. To approximate a time-varying stock weight, let's use a cubic polynomial. Thus, let w(t)=ao+ait+at+azt, where the four parameters ao, ai, az, az, are chosen optimally by the investor. This would imply that the stock weight formed at the beginning of time t=jh is ao+a1(jh)+22[j+h)2+a; (jh), where; is the month number (0,...,59) and thus jh is in calendar time. For an A of 5, what are the investor's optimal choices of ao, ai, az, az? 5. For the optimal strategy determined in question 4, plot the weight in stock as a function of t. Provide intuition for the graph. 6. Now, consider a different kind of strategy: a buy-and-hold portfolio. That is, you put an initial weight of 60% in stock and 40% in cash. However, you never rebalance, and just leave the portfolio alone. (Your initial dollars in stock simply grow over time with the realized return on stock. Your initial dollars in cash simply grow over time with the riskless rate. Adding the two together will give you the future value of the entire portfolio.) Simulate the portfolio path over 5 years. Provide a histogram of the ending portfolio value


