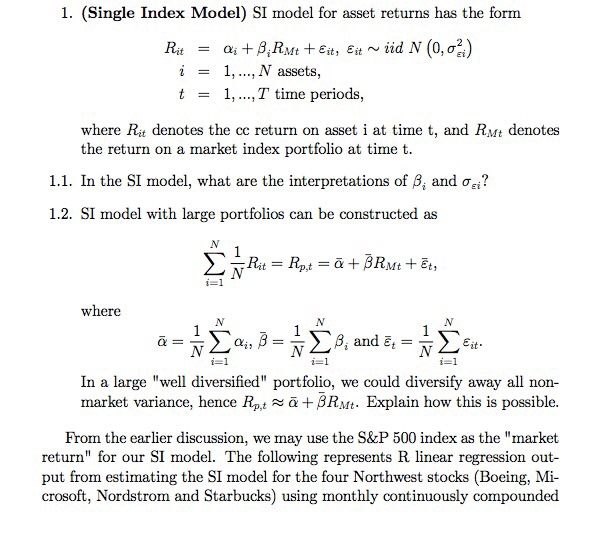
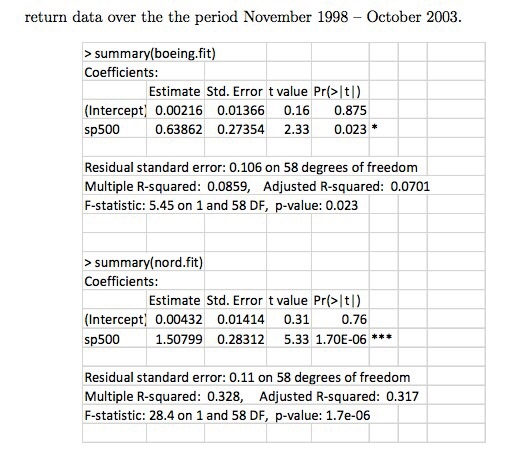
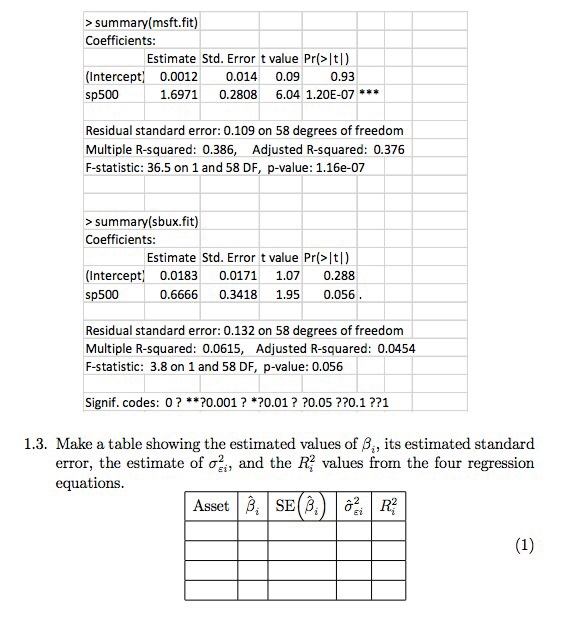
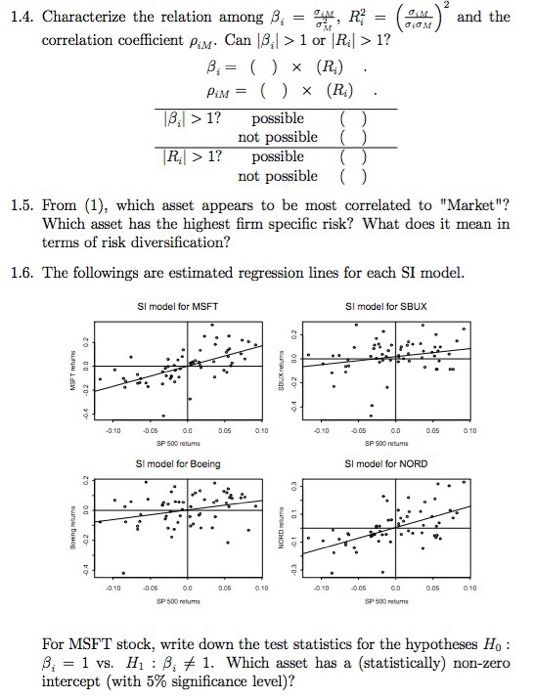
1. (Single Index Model) SI model for asset returns has the form i -1,..., N assets, t = 1, T time periods, where Rit denotes the cc return on asset i at time t, and RMt denotes the return on a market index portfolio at time t 1.1. In the SI model, what are the interpretations of A, and ? 1.2. SI model with large portfolios can be constructed as 1 where 3, and et- In a large "well diversified" portfolio, we could diversify away all non- market variance, hence Rp,t +RMt-Explain how this is possible. From the earlier discussion, we may use the S&P 500 index as the "market return" for our SI model. The following represents R linear regression out- put from estimating the SI model for the four Northwest stocks (Boeing, Mi crosoft, Nordstrom and Starbucks) using monthly continuously compounded return data over the the period November 1998- October 2003. summary(boeing.fit) Coefficients: Estimate Std. Error t value Pr(>It|) (Intercept 0.00216 0.01366 0.16 0.875 sp500 0.638620.274 2.33 0.023* Residual standard error: 0.106 on 58 degrees of freedom Multiple R-squared: 0.0859, Adjusted R-squared: 0.0701 F-statistic: 5.45 on 1 and 58 DF, p-value: 0.023 summary(nord.fit) Coefficients: Estimate Std. Error t value Pr(>It) Intercept o.00432 0.01414 01 0.76 sp500 1.507990.28312 5.33 1.70E-06*** Residual standard error: 0.11 on 58 degrees of freedom Multiple R-squared: 0.328, Adjusted R-squared: 0.317 F-statistic: 28.4 on 1 and 58 DF, p-va: 1.7e-06 sumary(msft.fit) Coefficient (Intercept 0.0012 sp500 Estimate Std. Error t value Pr(> Itl) 0.93 1.6971 0.2808 6.04 1.20E-07 0.014 0.09 Residual standard error: 0.109 on 58 degrees of freedom Multiple R-squared: 0.386, Adjusted R-squared: 0.376 F-statistic: 36.5 on 1 and 58 DF, p-value: 1.16e-07 >summary(sbux.fit) Coefficient Estimate Std. Error t value Pr(> It]) (Intercept 0.0183 0.01711.07 0.288 sp500 0.6666 0.3418 1.95 0.056 Residual standard error: 0.132 on 58 degrees of freedom Multiple R-squared: 0.0615, Adjusted R-squared: 0.0454 F-statistic: 3.8 on 1 and 58 DF, p-value: 0.056 Signif. codes: 0? *0.001? 0.01? ?0.05??0.1??1 Make a table showing the estimated values of i, its estimated standard error, the estimate of , and the R, values from the four regression equations 1.3. 1.4. characterize the relation among .-SAL, l (AL) and the correlation coefficient piM. Can ,| > 1 or |Ri > 1? ( ) (R) ,>1? possible not possible R1 possible not possible () 1.5. From (1), which asset appears to be most correlated to "Market"? Which asset has the highest firm specific risk? What does it mean in terms of risk diversification? 1.6. The followings are estimated regression lines for each SI model. SI model for MSFT SI model for SBUX 0.10 0.05 0.10 0.10 0.05 0.0 0.10 SI model for Boeing SI model for NORD 940 0.06 0.50 01D 006 0 90 SP 500 retums SP 500 retuns For MSFT stock, write down the test statistics for the hypotheses Ho 3, = 1 vs. Hi : 1. Which asset has a (statistically) non-zero intercept (with 5% significance level)? 1. (Single Index Model) SI model for asset returns has the form i -1,..., N assets, t = 1, T time periods, where Rit denotes the cc return on asset i at time t, and RMt denotes the return on a market index portfolio at time t 1.1. In the SI model, what are the interpretations of A, and ? 1.2. SI model with large portfolios can be constructed as 1 where 3, and et- In a large "well diversified" portfolio, we could diversify away all non- market variance, hence Rp,t +RMt-Explain how this is possible. From the earlier discussion, we may use the S&P 500 index as the "market return" for our SI model. The following represents R linear regression out- put from estimating the SI model for the four Northwest stocks (Boeing, Mi crosoft, Nordstrom and Starbucks) using monthly continuously compounded return data over the the period November 1998- October 2003. summary(boeing.fit) Coefficients: Estimate Std. Error t value Pr(>It|) (Intercept 0.00216 0.01366 0.16 0.875 sp500 0.638620.274 2.33 0.023* Residual standard error: 0.106 on 58 degrees of freedom Multiple R-squared: 0.0859, Adjusted R-squared: 0.0701 F-statistic: 5.45 on 1 and 58 DF, p-value: 0.023 summary(nord.fit) Coefficients: Estimate Std. Error t value Pr(>It) Intercept o.00432 0.01414 01 0.76 sp500 1.507990.28312 5.33 1.70E-06*** Residual standard error: 0.11 on 58 degrees of freedom Multiple R-squared: 0.328, Adjusted R-squared: 0.317 F-statistic: 28.4 on 1 and 58 DF, p-va: 1.7e-06 sumary(msft.fit) Coefficient (Intercept 0.0012 sp500 Estimate Std. Error t value Pr(> Itl) 0.93 1.6971 0.2808 6.04 1.20E-07 0.014 0.09 Residual standard error: 0.109 on 58 degrees of freedom Multiple R-squared: 0.386, Adjusted R-squared: 0.376 F-statistic: 36.5 on 1 and 58 DF, p-value: 1.16e-07 >summary(sbux.fit) Coefficient Estimate Std. Error t value Pr(> It]) (Intercept 0.0183 0.01711.07 0.288 sp500 0.6666 0.3418 1.95 0.056 Residual standard error: 0.132 on 58 degrees of freedom Multiple R-squared: 0.0615, Adjusted R-squared: 0.0454 F-statistic: 3.8 on 1 and 58 DF, p-value: 0.056 Signif. codes: 0? *0.001? 0.01? ?0.05??0.1??1 Make a table showing the estimated values of i, its estimated standard error, the estimate of , and the R, values from the four regression equations 1.3. 1.4. characterize the relation among .-SAL, l (AL) and the correlation coefficient piM. Can ,| > 1 or |Ri > 1? ( ) (R) ,>1? possible not possible R1 possible not possible () 1.5. From (1), which asset appears to be most correlated to "Market"? Which asset has the highest firm specific risk? What does it mean in terms of risk diversification? 1.6. The followings are estimated regression lines for each SI model. SI model for MSFT SI model for SBUX 0.10 0.05 0.10 0.10 0.05 0.0 0.10 SI model for Boeing SI model for NORD 940 0.06 0.50 01D 006 0 90 SP 500 retums SP 500 retuns For MSFT stock, write down the test statistics for the hypotheses Ho 3, = 1 vs. Hi : 1. Which asset has a (statistically) non-zero intercept (with 5% significance level)