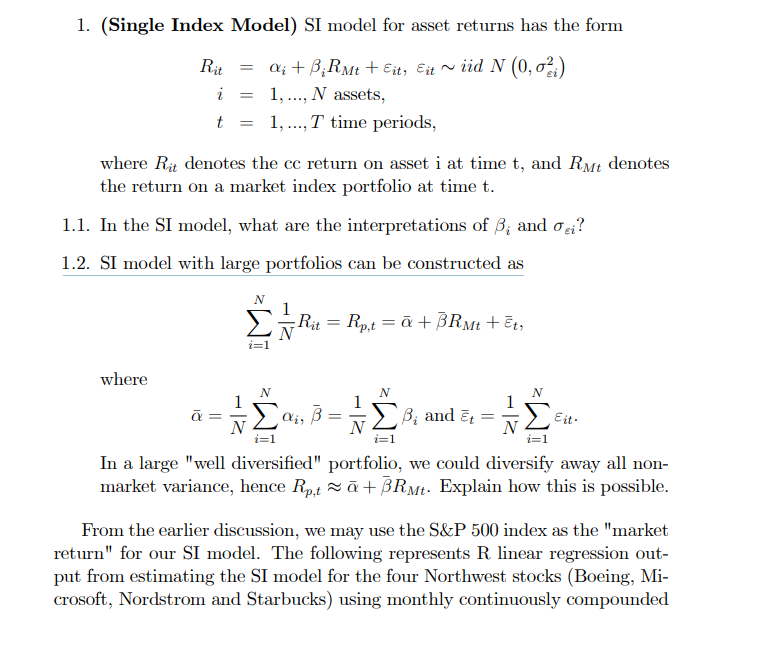
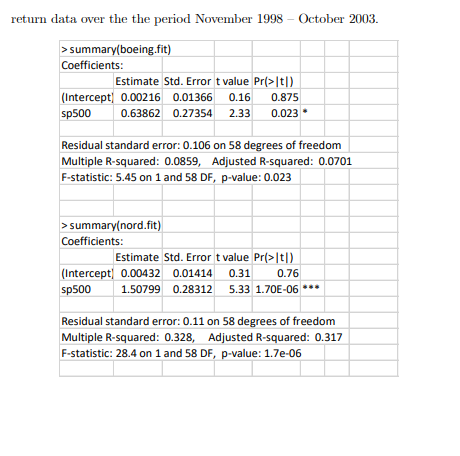
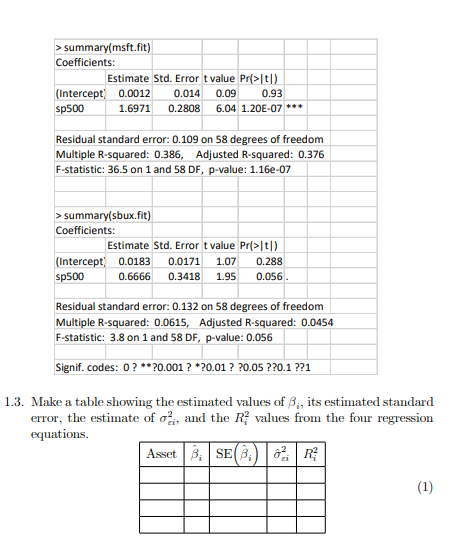
1. (Single Index Model) SI model for asset returns has the form Rit di +B;RMt + Eit, Eit ~ iid N (0,02) i 1, ..., N assets, t 1, ..., T time periods, where Rit denotes the cc return on asset i at time t, and Rmt denotes the return on a market index portfolio at time t. 1.1. In the SI model, what are the interpretations of B; and gi? 1.2. SI model with large portfolios can be constructed as N Rit Rp,t = a + BRMt + Et, where N N ;, = 8 B; and Et N 1 N i=1 Eit. N N i=1 i=1 In a large "well diversified" portfolio, we could diversify away all non- market variance, hence Rp,t m+BRMt. Explain how this is possible. From the earlier discussion, we may use the S&P 500 index as the "market return" for our SI model. The following represents R linear regression out- put from estimating the SI model for the four Northwest stocks (Boeing, Mi- crosoft, Nordstrom and Starbucks) using monthly continuously compounded return data over the the period November 1998 October 2003 > summary(boeing.fit) Coefficients: Estimate Std. Error t value Pr>|t|) (Intercept) 0.00216 0.01366 0.16 0.875 sp500 0.63862 0.27354 2.33 0.023 Residual standard error: 0.106 on 58 degrees of freedom Multiple R-squared: 0.0859, Adjusted R-squared: 0.0701 F-statistic: 5.45 on 1 and 58 DF, p-value: 0.023 > summary(nord.fit) Coefficients: Estimate Std. Error t value Pri>It|) (Intercept) 0.00432 0.01414 0.31 0.76 sp500 1.50799 0.28312 5.33 1.70E-06 *** Residual standard error: 0.11 on 58 degrees of freedom Multiple R-squared: 0.328, Adjusted R-squared: 0.317 F-statistic: 28.4 on 1 and 58 DF, p-value: 1.72-06 > summary(msft.fit) Coefficients: Estimate Std. Error t value Pr>t1) (Intercept) 0.0012 0.014 0.09 0.93 sp500 1.6971 0.2808 6.04 1.20E-07 *** Residual standard error: 0.109 on 58 degrees of freedom Multiple R-squared: 0.386, Adjusted R-squared: 0.376 F-statistic: 36.5 on 1 and 58 DF, p-value: 1.168-07 > summary(sbux.fit) Coefficients: Estimate Std. Error t value Pr(>1) (Intercept) 0.0183 0.0171 1.07 0.288 sp500 0.6666 0.3418 1.95 0.056 Residual standard error: 0.132 on 58 degrees of freedom Multiple R-squared: 0.0615, Adjusted R-squared: 0.0454 F-statistic: 3.8 on 1 and 58 DF, p-value: 0.056 Signif. codes: 0?**?0.001 ? *20.01 ? ?0.05 ??0.1 ??1 1.3. Make a table showing the estimated values of B., its estimated standard error, the estimate of o, and the R values from the four regression equations. Asset B.SEBR (1) 1. (Single Index Model) SI model for asset returns has the form Rit di +B;RMt + Eit, Eit ~ iid N (0,02) i 1, ..., N assets, t 1, ..., T time periods, where Rit denotes the cc return on asset i at time t, and Rmt denotes the return on a market index portfolio at time t. 1.1. In the SI model, what are the interpretations of B; and gi? 1.2. SI model with large portfolios can be constructed as N Rit Rp,t = a + BRMt + Et, where N N ;, = 8 B; and Et N 1 N i=1 Eit. N N i=1 i=1 In a large "well diversified" portfolio, we could diversify away all non- market variance, hence Rp,t m+BRMt. Explain how this is possible. From the earlier discussion, we may use the S&P 500 index as the "market return" for our SI model. The following represents R linear regression out- put from estimating the SI model for the four Northwest stocks (Boeing, Mi- crosoft, Nordstrom and Starbucks) using monthly continuously compounded return data over the the period November 1998 October 2003 > summary(boeing.fit) Coefficients: Estimate Std. Error t value Pr>|t|) (Intercept) 0.00216 0.01366 0.16 0.875 sp500 0.63862 0.27354 2.33 0.023 Residual standard error: 0.106 on 58 degrees of freedom Multiple R-squared: 0.0859, Adjusted R-squared: 0.0701 F-statistic: 5.45 on 1 and 58 DF, p-value: 0.023 > summary(nord.fit) Coefficients: Estimate Std. Error t value Pri>It|) (Intercept) 0.00432 0.01414 0.31 0.76 sp500 1.50799 0.28312 5.33 1.70E-06 *** Residual standard error: 0.11 on 58 degrees of freedom Multiple R-squared: 0.328, Adjusted R-squared: 0.317 F-statistic: 28.4 on 1 and 58 DF, p-value: 1.72-06 > summary(msft.fit) Coefficients: Estimate Std. Error t value Pr>t1) (Intercept) 0.0012 0.014 0.09 0.93 sp500 1.6971 0.2808 6.04 1.20E-07 *** Residual standard error: 0.109 on 58 degrees of freedom Multiple R-squared: 0.386, Adjusted R-squared: 0.376 F-statistic: 36.5 on 1 and 58 DF, p-value: 1.168-07 > summary(sbux.fit) Coefficients: Estimate Std. Error t value Pr(>1) (Intercept) 0.0183 0.0171 1.07 0.288 sp500 0.6666 0.3418 1.95 0.056 Residual standard error: 0.132 on 58 degrees of freedom Multiple R-squared: 0.0615, Adjusted R-squared: 0.0454 F-statistic: 3.8 on 1 and 58 DF, p-value: 0.056 Signif. codes: 0?**?0.001 ? *20.01 ? ?0.05 ??0.1 ??1 1.3. Make a table showing the estimated values of B., its estimated standard error, the estimate of o, and the R values from the four regression equations. Asset B.SEBR (1)