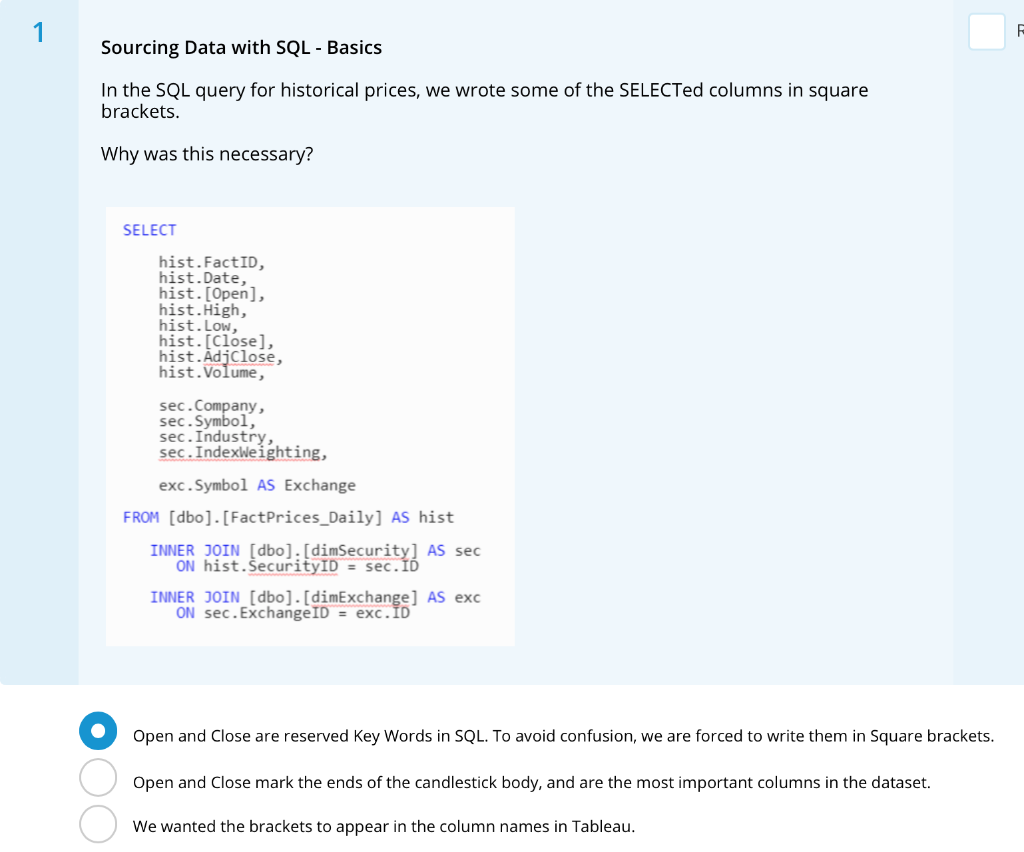
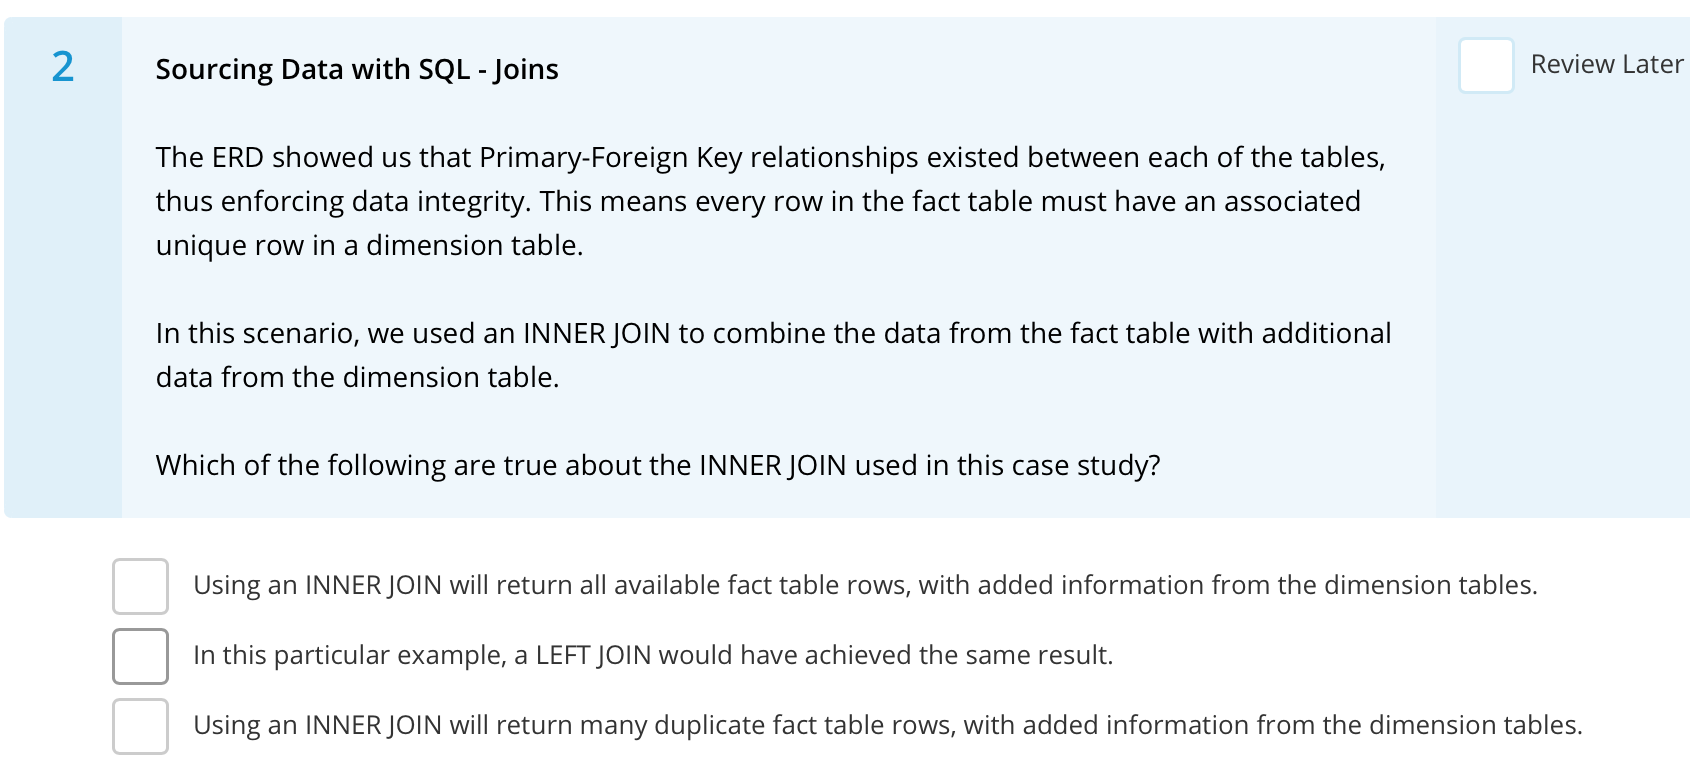
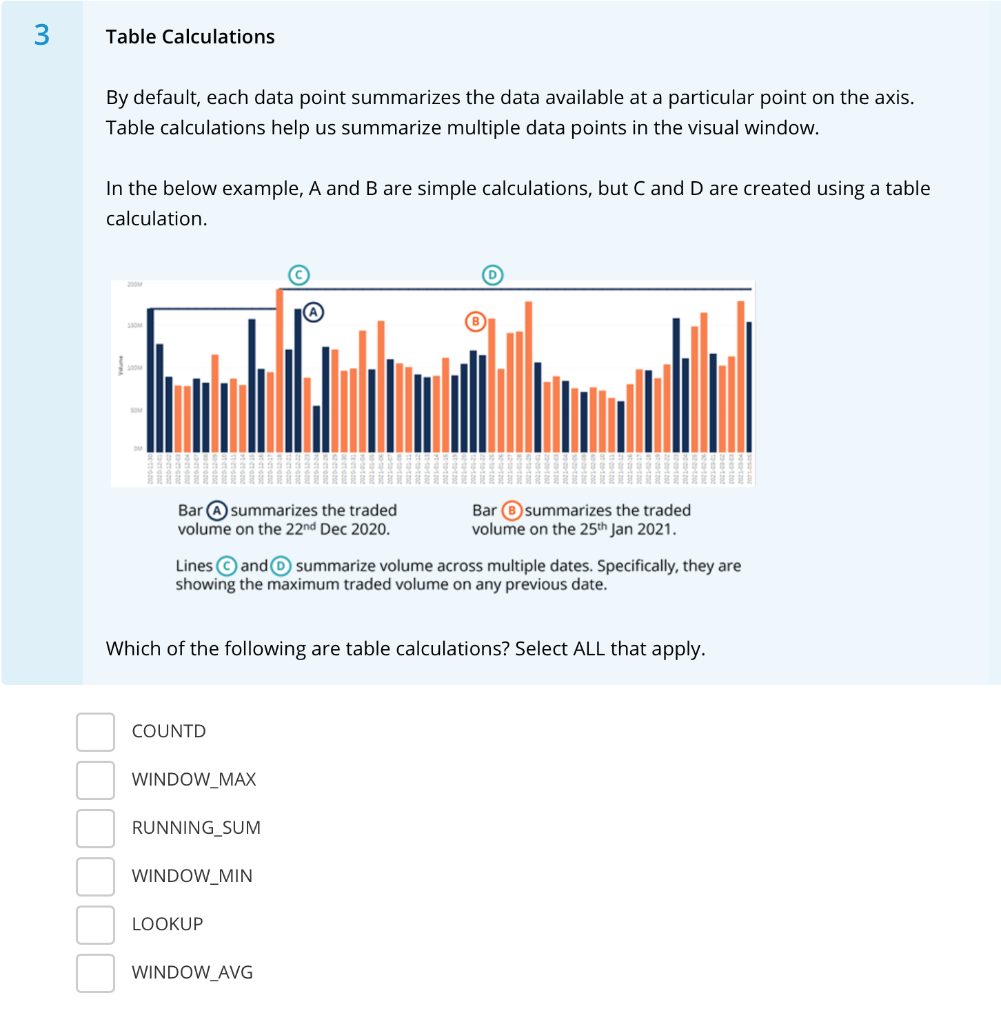
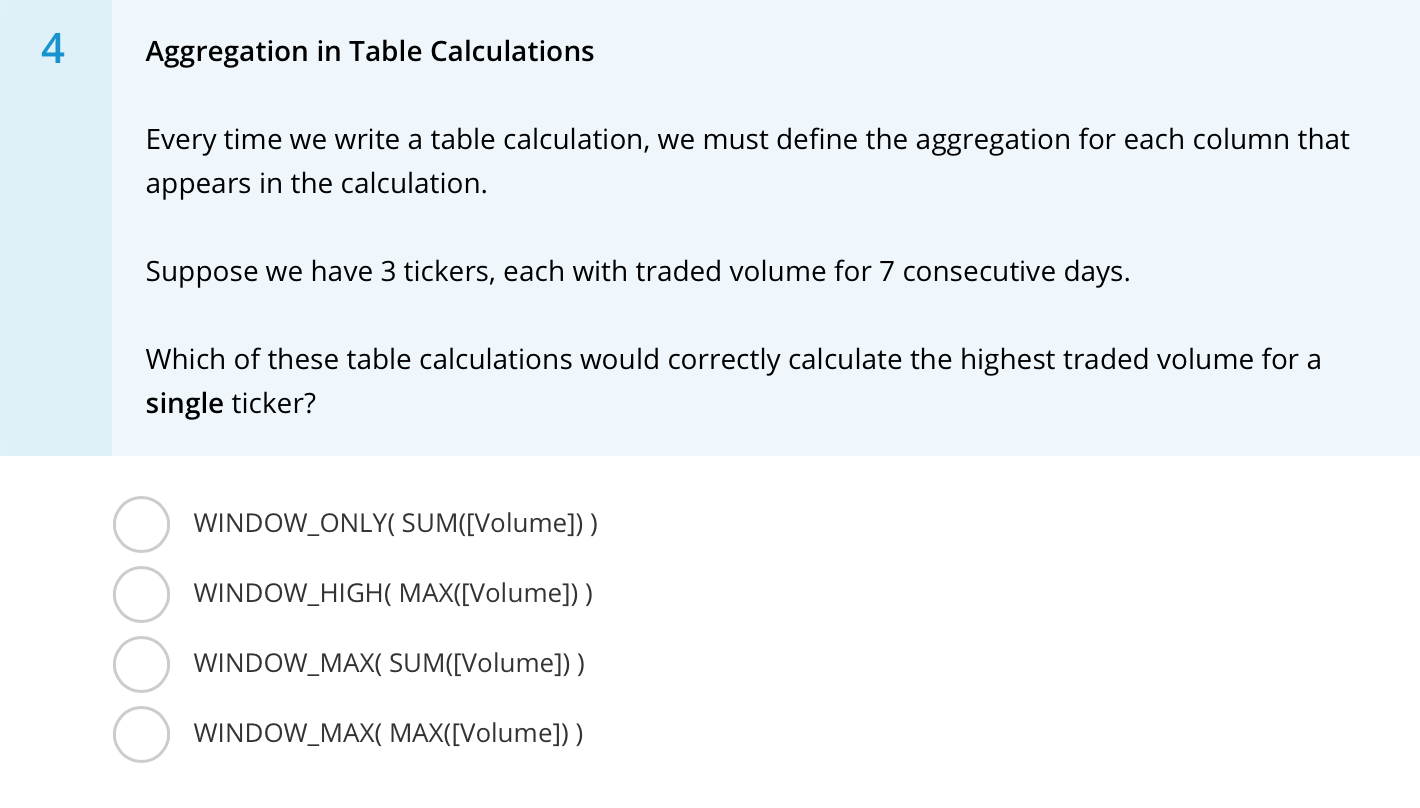
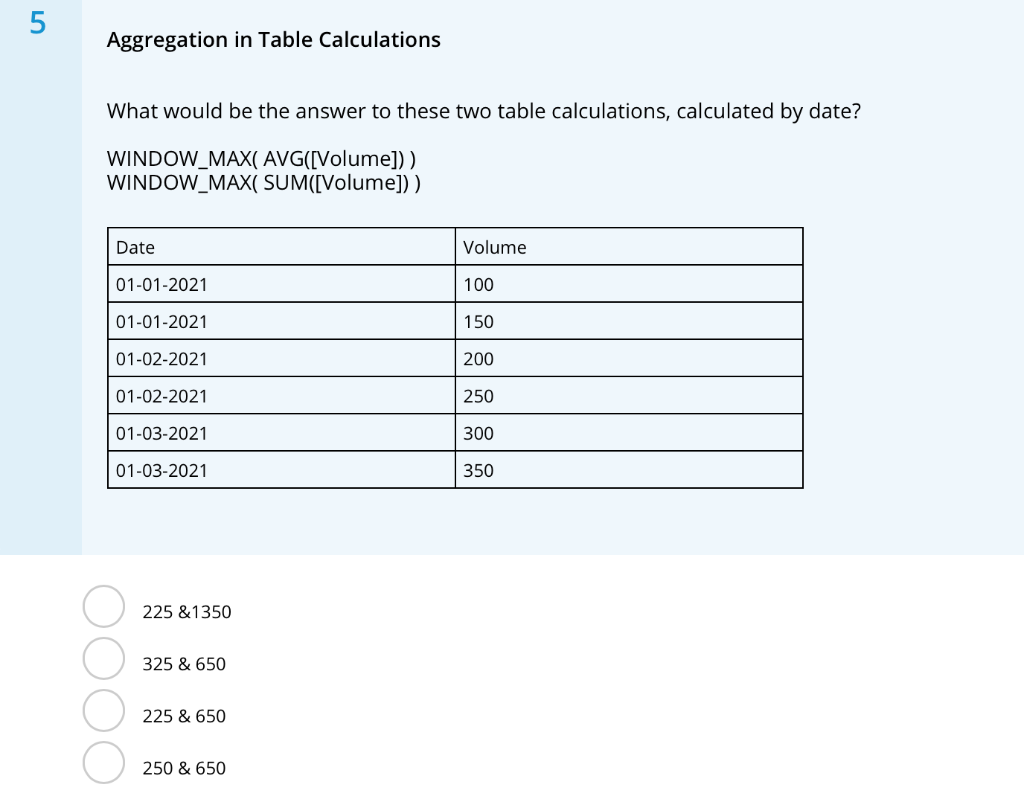
1 Sourcing Data with SQL - Basics In the SQL query for historical prices, we wrote some of the SELECTed columns in square brackets. Why was this necessary? SELECT hist. Low hist. FactID, hist.Date, hist. [Open], hist. High, hist. [Close), hist. Adjclose, hist. Volume, sec.Company, sec. Symbol, sec. Industry sec. IndexWeighting, exc. Symbol AS Exchange FROM [dbo].[FactPrices_Daily] AS hist INNER JOIN [dbo].[dimSecurity] AS sec ON hist. SecurityID = sec.ID INNER JOIN [dbo]. [dimExchange) AS exc ON sec. Exchange ID = exc.id Open and Close are reserved Key Words in SQL. To avoid confusion, we are forced to write them in Square brackets. Open and Close mark the ends of the candlestick body, and are the most important columns in the dataset. We wanted the brackets to appear in the column names in Tableau. 2 Sourcing Data with SQL - Joins Review Later The ERD showed us that Primary-Foreign Key relationships existed between each of the tables, thus enforcing data integrity. This means every row in the fact table must have an associated unique row in a dimension table. In this scenario, we used an INNER JOIN to combine the data from the fact table with additional data from the dimension table. Which of the following are true about the INNER JOIN used in this case study? Using an INNER JOIN will return all available fact table rows, with added information from the dimension tables. In this particular example, a LEFT JOIN would have achieved the same result. Using an INNER JOIN will return many duplicate fact table rows, with added information from the dimension tables. Table Calculations By default, each data point summarizes the data available at a particular point on the axis. Table calculations help us summarize multiple data points in the visual window. In the below example, A and B are simple calculations, but C and D are created using a table calculation. Bar A summarizes the traded volume on the 22nd Dec 2020. Bar B summarizes the traded volume on the 25th Jan 2021. Lines and summarize volume across multiple dates. Specifically, they are showing the maximum traded volume on any previous date. Which of the following are table calculations? Select ALL that apply. COUNTD WINDOW_MAX RUNNING_SUM WINDOW_MIN LOOKUP WINDOW_AVG 4 Aggregation in Table Calculations Every time we write a table calculation, we must define the aggregation for each column that appears in the calculation. Suppose we have 3 tickers, each with traded volume for 7 consecutive days. Which of these table calculations would correctly calculate the highest traded volume for a single ticker? WINDOW_ONLY( SUM([Volume])) WINDOW_HIGH( MAX([Volume])) WINDOW_MAX( SUM([Volume])) WINDOW_MAX( MAX([Volume])) 5 Aggregation in Table Calculations What would be the answer to these two table calculations, calculated by date? WINDOW_MAX( AVG([Volume])) WINDOW_MAX( SUM([Volume])) Date Volume 01-01-2021 100 01-01-2021 150 01-02-2021 200 01-02-2021 250 01-03-2021 300 01-03-2021 350 225 &1350 325 & 650 225 & 650 250 & 650