

Question
1 Start Excel. Open the downloaded Excel file named exploring_e03_grader_h1.xlsx . 0 2 Set chart filters to remove the Category Totals and the Weekly Totals.
| 1 | Start Excel. Open the downloaded Excel file namedexploring_e03_grader_h1.xlsx. | 0 |
| 2 | Set chart filters to remove the Category Totals and the Weekly Totals. | 6 |
| 3 | Position and size the chart to fill the range A18:K37. | 6 |
| 4 | Change the row and column orientation so that the weeks appear in the category axis and the genres appear in the legend. | 5 |
| 5 | Add a value axis title and type Number of Downloads. Apply Black, Text 1 font color to the value axis title. | 6 |
| 6 | Move the legend to the right side of the chart and drag the bottom of the chart area down to cover row 37, if necessary. | 5 |
| 7 | Select the Drama data series and add data labels in the Outside End position. Add a default Gradient fill to the data labels. | 6 |
| 8 | Click cell G5 and insert Line Sparklines for the weekly data for each category and the weekly totals, but do not include the category totals for the data range. The location range should be G5:G15. | 8 |
| 9 | Apply the Sparkline Style Accent 3, (no dark or light) sparkline style. | 4 |
| 10 | Show the high point and markers for the sparklines. Change the high point marker color to Red. | 6 |
| 11 | Select the range A4:E14. Create a stacked bar chart. Move the chart to new sheet. Type Bar Chart for the sheet name. | 6 |
| 12 | Add a chart title above the bar chart and type November 2016 Weekly Downloads. Apply bold and Blue, Accent 5 font color to the bar chart title. | 8 |
| 13 | Apply 11 pt font size to the category axis, value axis, and the legend for the bar chart. | 6 |
| 14 | Use the Axis Options to display the value axis in units of Thousands, set the Major Units to 500, apply the Number format with 1 decimal place for the bar chart. | 10 |
| 15 | Use the Axis Options to format the category axis so that the category labels are in reverse order. | 4 |
| 16 | Create a footer on each worksheet with the text Exploring Series on the left side, the sheet name code in the center, and the file name code on the right side. | 6 |
| 17 | Apply landscape orientation for the Data worksheet. | 2 |
| 18 | Set 0.2 inch left, right, top, and bottom margins for the Data worksheet. Change the scaling so that the worksheet fits on only one page. | 6 |
| 19 | Ensure that the worksheets are correctly named and placed in the following order in the workbook: Bar Chart, Data. Save the workbook. Close the workbook and then exit Excel. Submit the workbook as directed. |
please show updated excell version.
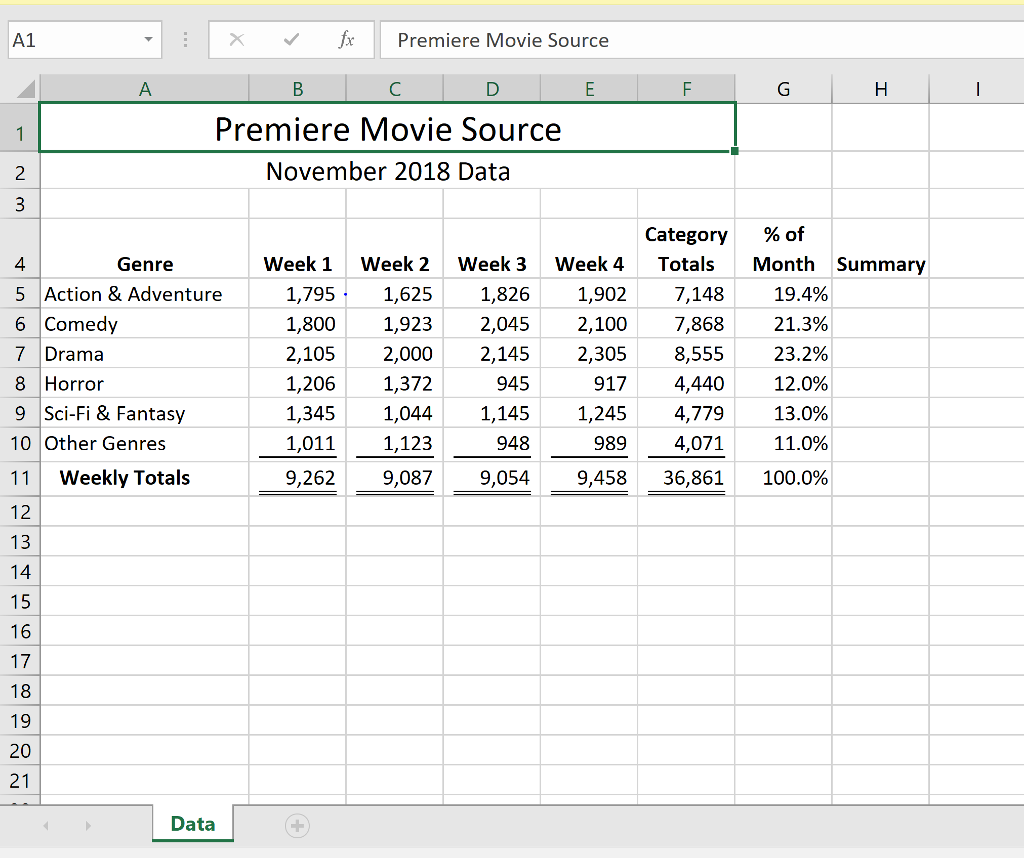
A1 Premiere Movie Source Premiere Movie Source November 2018 Data Category %of Week 1Week 2 Week 3 Week 4Totals Month Summary 4 5 Action & Adventure 6 Comedy 7 Drama 8 Horror 9 Sci-Fi & Fantasy 10 Other Genres 11 Weekly Totals 12 13 Genre 7,148 1,795 1,800 1,923 2,045 2,100 7,868 21.3% 2,105 1,206 1,345 1,011 9,262 9,087 9,054 9,458 36,861 100.0% 1,625 1,826 1,902 19.4% 2,000 1,372 1,044 1,123 2,145 945 1,145 948 2,305 917 1,245 989 8,555 4,440 4,779 4,071 23.2% 12.0% 13.0% 11.0% 15 16 17 18 19 20 21 Data A1 Premiere Movie Source Premiere Movie Source November 2018 Data Category %of Week 1Week 2 Week 3 Week 4Totals Month Summary 4 5 Action & Adventure 6 Comedy 7 Drama 8 Horror 9 Sci-Fi & Fantasy 10 Other Genres 11 Weekly Totals 12 13 Genre 7,148 1,795 1,800 1,923 2,045 2,100 7,868 21.3% 2,105 1,206 1,345 1,011 9,262 9,087 9,054 9,458 36,861 100.0% 1,625 1,826 1,902 19.4% 2,000 1,372 1,044 1,123 2,145 945 1,145 948 2,305 917 1,245 989 8,555 4,440 4,779 4,071 23.2% 12.0% 13.0% 11.0% 15 16 17 18 19 20 21 DataStep by Step Solution
There are 3 Steps involved in it
Step: 1

Get Instant Access to Expert-Tailored Solutions
See step-by-step solutions with expert insights and AI powered tools for academic success
Step: 2

Step: 3
Ace Your Homework with AI
Get the answers you need in no time with our AI-driven, step-by-step assistance
Get Started
Intelligent Information And Database Systems Asian Conference Aciids 2012 Kaohsiung Taiwan March 19 21 2012 Proceedings Part 3 Lnai 7198
Authors: Jeng-Shyang Pan ,Shyi-Ming Chen ,Ngoc-Thanh Nguyen
2012th Edition
3642284922, 978-3642284922