Answered step by step
Verified Expert Solution
Question
1 Approved Answer
1) Study the selected financial information of Netflix for the years 2017 to 2021 as shown in the Netflix selected info 2017 to 2021 file
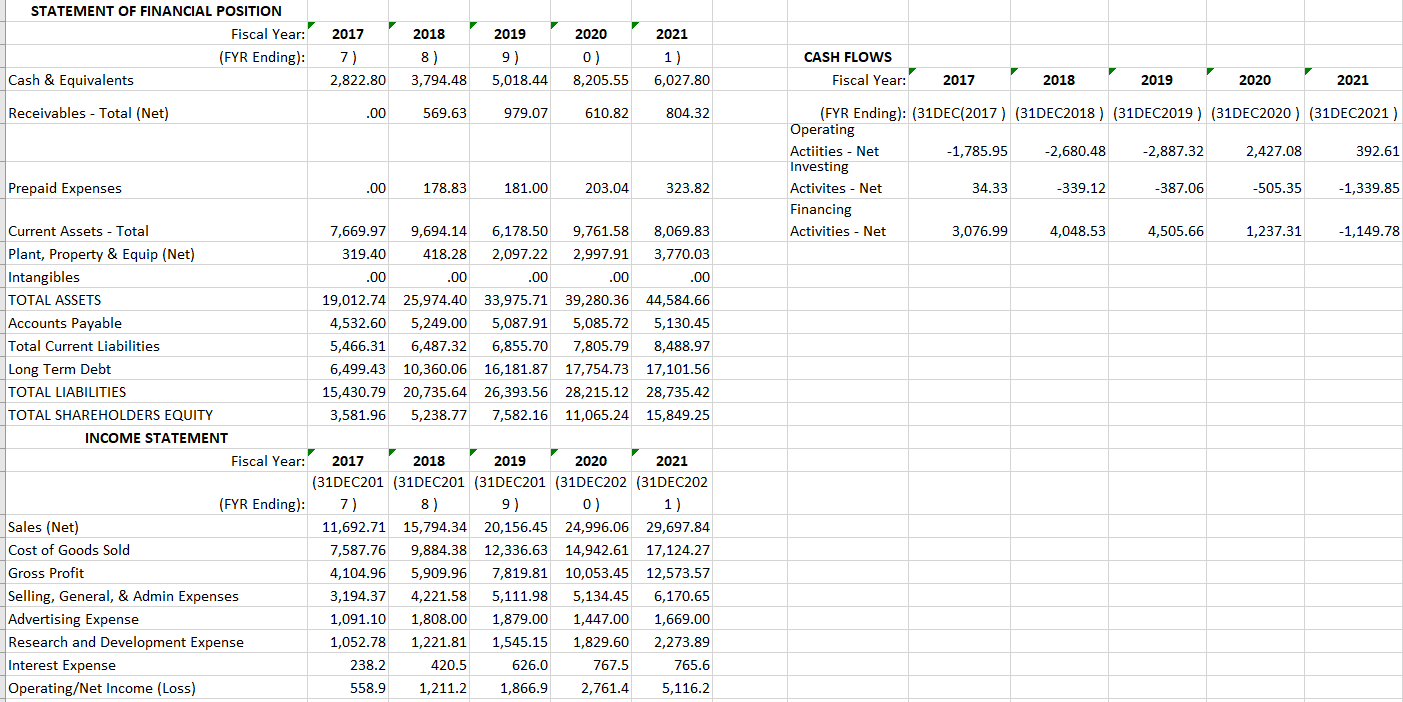
 1) Study the selected financial information of Netflix for the years 2017 to 2021 as shown in the Netflix selected info 2017 to 2021 file in the Supporting Information folder. The folder is located just below the link to this document. Using the information, calculate the following ratios for the years 2018 and 2021:
A) Gross profit margin B) Operating profit margin C) Return on equity D) Average settlement period (Accounts receivable) E) Asset turnover F) Current ratio G) Quick ratio H) Interest coverage ratio I) Debt to equity ratio
STATEMENT OF FINANCIAL POSITION Fiscal Year: (FYR Ending): Cash & Equivalents Receivables - Total (Net) Prepaid Expenses Current Assets - Total Plant, Property & Equip (Net) Intangibles TOTAL ASSETS Accounts Payable Total Current Liabilities Long Term Debt TOTAL LIABILITIES TOTAL SHAREHOLDERS EQUITY INCOME STATEMENT Sales (Net) Cost of Goods Sold Gross Profit Selling, General, & Admin Expenses Advertising Expense Research and Development Expense Interest Expense Operating/Net Income (Loss) Fiscal Year: (FYR Ending): 2018 2019 2020 2021 2017 7) 2,822.80 9) 0) 1) 8) 3,794.48 5,018.44 8,205.55 6,027.80 .00 569.63 979.07 610.82 804.32 .00 178.83 181.00 203.04 323.82 7,669.97 9,694.14 6,178.50 9,761.58 8,069.83 319.40 418.28 2,097.22 2,997.91 3,770.03 .00 .00 .00 .00 .00 19,012.74 25,974.40 33,975.71 39,280.36 44,584.66 4,532.60 5,249.00 5,087.91 5,085.72 5,130.45 5,466.31 6,487.32 6,855.70 7,805.79 8,488.97 6,499.43 10,360.06 16,181.87 17,754.73 17,101.56 15,430.79 20,735.64 26,393.56 28,215.12 28,735.42 3,581.96 5,238.77 7,582.16 11,065.24 15,849.25 2017 2018 2019 2020 2021 (31DEC201 (31DEC201 (31DEC201 (31DEC202 (31DEC202 7) 8) 9) 0) 1) 11,692.71 15,794.34 20,156.45 24,996.06 29,697.84 7,587.76 9,884.38 12,336.63 14,942.61 17,124.27 4,104.96 5,909.96 7,819.81 10,053.45 12,573.57 3,194.37 4,221.58 5,111.98 5,134.45 6,170.65 1,091.10 1,808.00 1,879.00 1,447.00 1,669.00 1,052.78 1,221.81 1,545.15 1,829.60 2,273.89 238.2 420.5 626.0 767.5 1,211.2 1,866.9 2,761.4 765.6 558.9 5,116.2 CASH FLOWS Fiscal Year: 2017 2018 2019 2020 2021 (FYR Ending): (31DEC(2017) (31DEC2018) (31DEC2019) (31DEC2020) (31DEC2021) Operating Actiities - Net Investing Activites - Net Financing Activities - Net -1,785.95 34.33 -2,680.48 -339.12 -2,887.32 -387.06 2,427.08 -505.35 392.61 -1,339.85 3,076.99 4,048.53 4,505.66 1,237.31 -1,149.78Step by Step Solution
There are 3 Steps involved in it
Step: 1

Get Instant Access to Expert-Tailored Solutions
See step-by-step solutions with expert insights and AI powered tools for academic success
Step: 2

Step: 3

Ace Your Homework with AI
Get the answers you need in no time with our AI-driven, step-by-step assistance
Get Started


