Answered step by step
Verified Expert Solution
Link Copied!

Question

1 Approved Answer

1. Suatu tracer test dengan pulse input memberikan kurva output seperti gambar dibawah ini : C (mol/l) t=1 t (menit) AR dengan - tA= 0,05
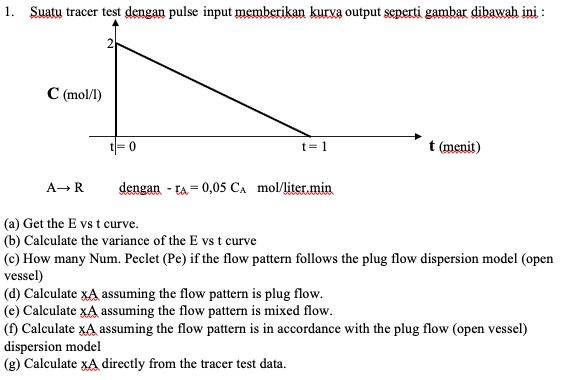
image text in transcribed
1. Suatu tracer test dengan pulse input memberikan kurva output seperti gambar dibawah ini : C (mol/l) t=1 t (menit) AR dengan - tA= 0,05 CA mol/liter.min (a) Get the E vst curve. (b) Calculate the variance of the E vs t curve (C) How many Num. Peclet (Pe) if the flow pattern follows the plug flow dispersion model (open vessel) (d) Calculate XA assuming the flow pattern is plug flow. (e) Calculate XA assuming the flow pattern is mixed flow. (1) Calculate XA assuming the flow pattern is in accordance with the plug flow (open vessel) dispersion model (g) Calculate XA directly from the tracer test data

Step by Step Solution

There are 3 Steps involved in it

Step: 1

blur-text-image

Get Instant Access to Expert-Tailored Solutions

See step-by-step solutions with expert insights and AI powered tools for academic success

Step: 2

blur-text-image

Step: 3

blur-text-image

Ace Your Homework with AI

Get the answers you need in no time with our AI-driven, step-by-step assistance

Get Started

Recommended Textbook for

Thermodynamics Fundamentals For Applications

Authors: J. P. O'Connell, J. M. Haile

1st Edition

0521582067, 978-0521582063

More Books

Students also viewed these Chemical Engineering questions