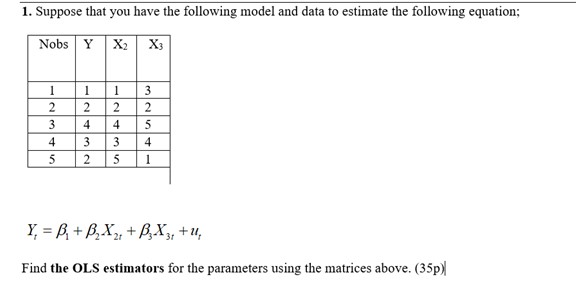
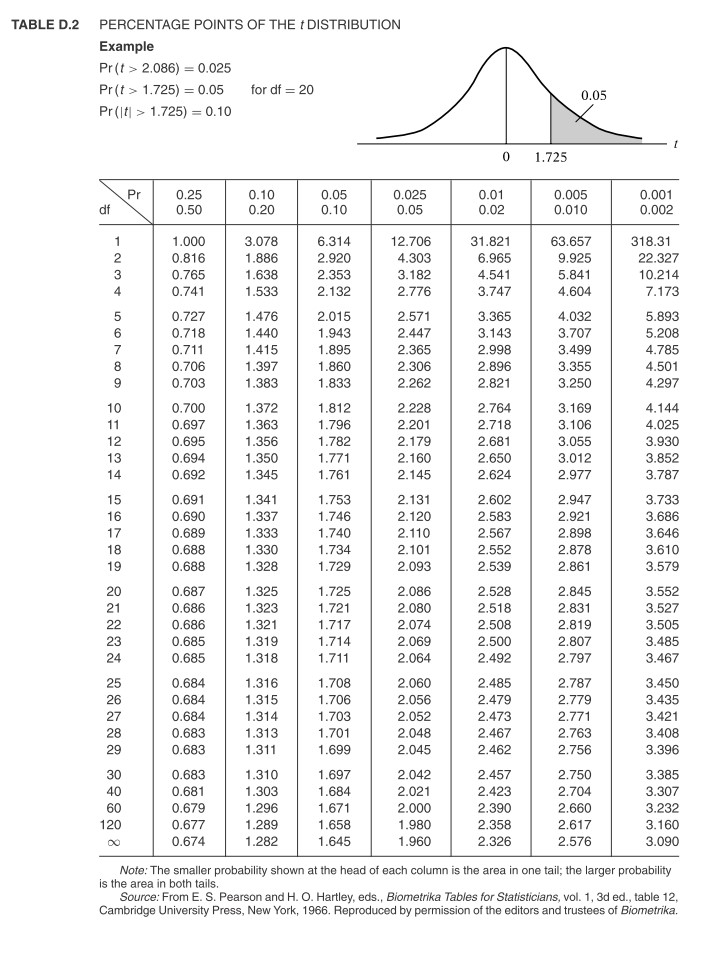
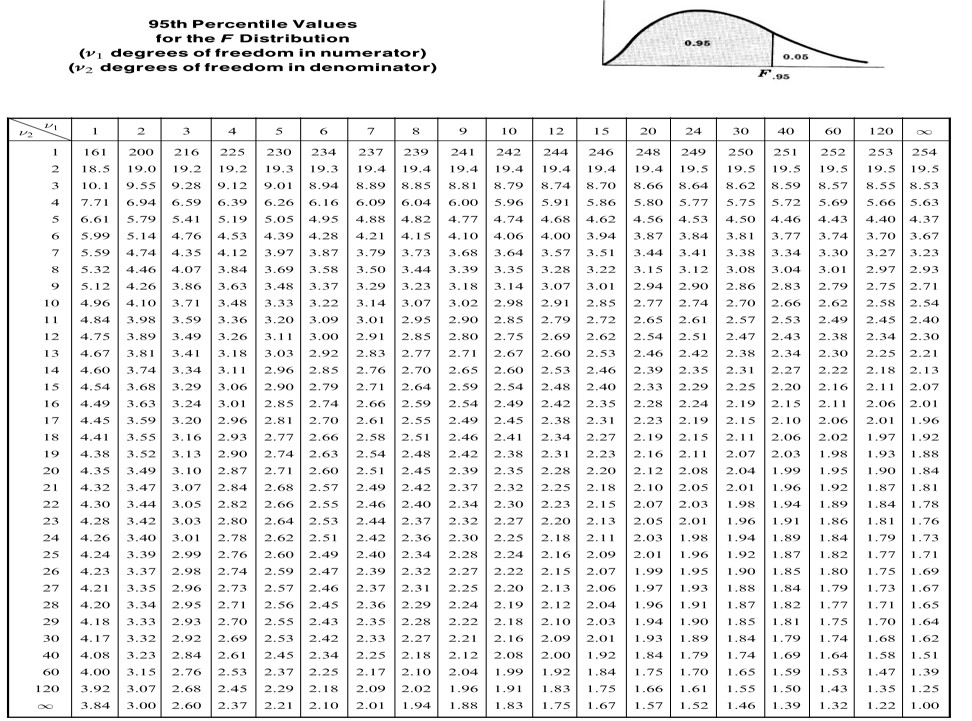
1. Suppose that you have the following model and data to estimate the following equation: Y: = (6| + ISIXZI' +EX3: 4'": Find the OLE estimators for the parameters using the matrices above. [351:] TABLE D.2 PERCENTAGE POINTS OF THE I DISTRIBUTION Example Pr (t > 2.086) = 0.025 Pr (t > 1.725) = 0.05 for df = 20 0.05 Pr (It) > 1.725) = 0.10 0 1.725 Pr 0.25 0.10 0.05 0.025 0.01 0.005 0.001 0.50 0.20 0.10 0.05 0.02 0.010 0.002 1.000 3.078 6.314 12.706 31.821 63.657 318.31 0.816 1.886 2.920 4.303 6.965 9.925 22.327 0.765 1.638 2.353 3.182 4.541 5.841 10.214 0.741 1.533 2.132 2.776 3.747 4.604 7.173 0.727 1.476 2.015 2.571 3.365 4.032 5.893 0.718 1.440 1.943 2.447 3.143 3.707 5.208 0.711 1.415 1.895 2.365 2.998 3.499 4.785 0.706 1.397 1.860 2.306 2.896 3.355 4.501 0.703 1.383 1.833 2.262 2.821 3.250 4.297 10 0.700 1.372 1.812 2.228 2.764 3.169 4.144 11 0.697 1.363 1.796 2.201 2.718 3.106 4.025 12 0.695 1.356 1.782 2.179 2.681 3.055 3.930 13 0.694 1.350 1.771 2.160 2.650 3.012 3.852 14 0.692 1.345 1.761 2.145 2.624 2.977 3.787 15 0.691 1.341 1.753 2.131 2.602 2.947 3.733 16 0.690 1.337 1.746 2.120 2.583 2.921 3.686 17 0.689 1.333 1.740 2.110 2.567 2.898 3.646 18 0.688 1.330 1.734 2.101 2.552 2.878 3.610 19 0.688 1.328 1.729 2.093 2.539 2.861 3.579 20 0.687 1.325 1.725 2.086 2.528 2.845 3.552 21 0.686 1.323 1.721 2.080 2.518 2.831 3.527 22 0.686 1.321 1.717 2.074 2.508 2.819 3.505 23 0.685 1.319 1.714 2.069 2.500 2.807 3.485 24 0.685 1.318 1.711 2.064 2.492 2.797 3.467 25 0.684 1.316 1.708 2.060 2.485 2.787 3.450 26 0.684 1.315 1.706 2.056 2.479 2.779 3.435 27 0.684 1.314 1.703 2.052 2.473 2.771 3.421 28 0.683 1.313 1.701 2.048 2.467 2.763 3.408 29 0.683 1.311 1.699 2.045 2.462 2.756 3.396 30 0.683 1.310 1.697 2.042 2.457 2.750 3.385 40 0.681 1.303 1.684 2.021 2.423 2.704 3.307 60 0.679 1.296 1.671 2.000 2.390 2.660 3.232 120 0.677 1.289 1.658 1.980 2.358 2.617 3.160 0.674 1.282 1.645 1.960 2.326 2.576 3.090 Note: The smaller probability shown at the head of each column is the area in one tail; the larger probability is the area in both tails. Source: From E. S. Pearson and H. O. Hartley, eds., Biometrika Tables for Statisticians, vol. 1, 3d ed., table 12, Cambridge University Press, New York, 1966. Reproduced by permission of the editors and trustees of Biometrika.95th Percentile Values for the F Distribution 0.96 (v] degrees of freedom in numerator) 0.06 (12 degrees of freedom in denominator) 2 3 7 8 10 12 15 20 24 30 40 60 120 161 200 216 225 230 234 237 239 241 242 244 246 248 249 250 25 257 253 254 18.5 19.0 19.2 19.2 19.3 19.3 19.4 19.4 19.4 19.4 19.4 19.4 19.5 WN - 19.4 19.5 19.5 19.5 19.5 19.5 10.1 9.55 9.28 9.12 9.01 8.94 8.89 8.85 8.81 8.79 8.74 8.70 8.66 8.64 8.62 8.59 8.57 3.55 8.53 4 7.71 6.94 6.59 6.39 6.26 6.16 6.09 6.04 6.00 5.96 5.91 5.86 5.80 5.77 5.75 5.72 5.69 5.66 5.63 6.61 5.79 5.41 5.19 5.05 4.95 4.88 4.82 4.77 4.74 4.68 4,62 4.56 4.53 4.50 4.46 4.43 4.40 4.37 6 5.99 5. 14 4.76 4.53 4.39 4.28 4.21 4.15 4.10 4.06 4.00 3.94 3.87 3.84 3.81 3.77 3.74 3.70 3.67 7 5.59 4.74 4.35 4. 12 3.97 3.87 3.79 3.73 3.68 3.64 3.57 3.51 3.44 3.41 3.38 3.34 3.30 3.27 3.23 8 5.32 4.46 4.07 3.84 3.69 3.58 3.50 3.44 3.39 3.35 3.28 3.22 3.15 3. 12 3.08 3.04 3.01 2.97 2.93 9 5.12 4.26 3.86 3.63 3.48 3.37 3.29 3.23 3.18 3. 14 3.07 3.01 2.94 2.90 2.86 2.83 2.79 2.75 2.71 10 4.96 4. 10 3.71 3.48 3.33 3.22 3.14 3.07 3.02 2.98 2.91 2.85 2.77 2.74 2.70 2.66 2.62 2.58 2.54 1 1 4.84 3.98 3.59 3.36 3.20 3.09 3.01 2.95 2.90 2.85 2.79 2.72 2.65 2.61 2.57 2.53 2.49 2.45 2.40 12 4.75 3.89 3.49 3.26 3.11 3.00 2.91 2.85 2.80 2.75 2.69 2.62 2.54 2.51 2.47 2.43 2.38 2.34 2.30 13 4.67 3.81 3.41 3. 18 3.03 2.92 2.83 2.77 2.71 2.67 2.60 2.53 2.46 2.42 2.38 2.34 2.30 2.25 2.21 14 4.60 3.74 3.34 3.11 2.96 2.85 2.76 2.70 2.65 2.60 2.53 2.46 2.39 2.35 2.31 2.27 2.22 2.18 2.13 15 4.54 3.68 3.29 3.06 2.90 2.79 2.71 2.64 2.59 2.54 2.48 2.40 2.33 2.29 2.25 2.20 2.16 2.11 2.07 16 4.49 3.63 3.24 3.01 2.85 2.74 2.66 2.59 2.54 2.49 2.42 2.35 2.28 2.24 2.19 2.15 2.1 1 2.06 2.01 17 4.45 3.59 3.20 2.96 2.81 2.70 2.61 2.55 2.49 2.45 2.38 2.31 2.23 2.19 2.15 2. 10 2.06 2.01 1.96 18 4.41 3.55 3.16 2.93 2.77 2.66 2.58 2.51 2.46 2.41 2.34 2.27 2.19 2.15 2. 11 2.06 2.02 1.97 1.92 19 4.38 3.52 3.13 2.90 2.74 2.63 2.54 2.48 2.42 2.38 2.31 2.23 2.16 2.11 2.07 2.03 1.98 1.93 1.88 20 4.35 3.49 3.10 2.87 2.71 2.60 2.51 2.45 2.39 2.35 2.28 2.20 2.12 2.08 2.04 1.99 1.95 1.90 1.84 21 4.32 3.47 3.07 2.84 2.68 2.57 2.49 2.42 2.37 2.32 2.25 2.18 2.10 2.05 2.01 1.96 1.92 1.87 1.81 22 4.30 3.44 3.05 2.82 2.66 2.55 2.46 2.40 2.34 2.30 2.23 2.15 2.07 2.03 1.98 1.94 1.89 1.84 1.78 23 4.28 3.42 3.03 2.80 2.64 2.53 2.44 2.37 2.32 2.27 2.20 2.13 2.05 2.01 1,96 1,91 1.86 1.81 1.76 24 4.26 3.40 3.01 2.78 2.62 2.51 2.42 2.36 2.30 2.25 2.18 2.11 2.03 1.98 1,94 1.89 1.84 1.79 1.73 25 4.24 3.39 2.99 2.76 2.60 2.49 2.40 2.34 2.28 2.24 2.16 2.09 2.01 1.96 1.92 1.87 1.82 1.77 1.71 26 4.23 3.37 2.98 2.74 2.59 2.47 2.39 2.32 2.27 2.22 2.15 2.07 1.99 1 95 1.90 1 85 1.80 1.75 1.69 27 4.21 3.35 2.96 2.73 2.57 2.46 2.37 2.31 2.25 2.20 2.13 2.06 1.97 1,93 1.88 1.84 1.79 1.73 1.67 28 4.20 3.34 2.95 2.71 2.56 2.45 2.36 2.29 2.24 2. 19 2.12 2.04 1.96 1.91 1.87 1,82 1.77 1.71 1.65 29 4.18 3.33 2.93 2.70 2.55 2.43 2.35 2.28 2.22 2.18 2.10 2.03 1.94 1.90 1.85 1.81 1.75 1.70 1.64 30 4.17 3.32 2.92 2.69 2.53 2.42 2.33 2.27 2.21 2.16 2.09 2.01 1.93 1.89 1.84 1.79 1.74 1.68 1.62 40 4.08 3.23 2.84 2.61 2.45 2.34 2.25 2.18 2.12 2.08 2.00 1.92 1.84 1.79 1.74 1.69 1.64 1.58 1.51 60 4.00 3.15 2.76 2.53 2.37 2.25 2.17 2.10 2.04 1.99 1.92 1.84 1.75 1.70 1.65 1.59 1.53 1.47 1.39 120 3.92 3.07 2.68 2.45 2.29 2.18 2.09 2.02 1.96 1.91 1.83 1.75 1.66 1.61 1.55 1.50 1.43 1.35 1.25 3.84 3.00 2.60 2.37 2.21 2.10 2.01 1.94 1.88 1.83 1.75 1.67 1.57 1.52 1.46 1.39 1.32 1.22 1.00