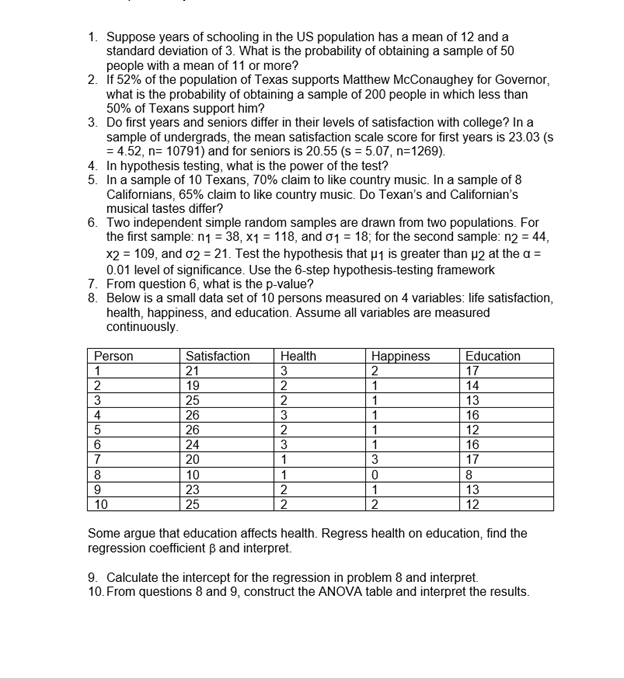
1. Suppose years of schooling in the US population has a mean of 12 and a standard deviation of 3. What is the probability of obtaining a sample of 50 people with a mean of 11 or more? 2. If 52% of the population of Texas supports Matthew Mcconaughey for Governor, what is the probability of obtaining a sample of 200 people in which less than 50% of Texans support him? 3. Do first years and seniors differ in their levels of satisfaction with college? In a sample of undergrads, the mean satisfaction scale score for first years is 23.03 (s = 4.52, n= 10791) and for seniors is 20.55 (s = 5.07, n=1269). 4. In hypothesis testing, what is the power of the test? 5. In a sample of 10 Texans, 70% claim to like country music. In a sample of 8 Californians, 65% claim to like country music. Do Texan's and Californian's musical tastes differ? 6. Two independent simple random samples are drawn from two populations. For the first sample: n1 = 38, x1 = 118, and 01 = 18; for the second sample: n2 = 44, x2 = 109, and 02 = 21. Test the hypothesis that py is greater than p2 at the a = 0.01 level of significance. Use the 6-step hypothesis-testing framework 7. From question 6, what is the p-value? 8. Below is a small data set of 10 persons measured on 4 variables: life satisfaction, health, happiness, and education. Assume all variables are measured continuously Person Satisfaction Health Happiness Education 1 21 2 17 19 14 25 2 1 13 14 26 3 1 16 5 26 2 1 12 6 24 3 1 16 7 20 1 3 17 8 10 0 8 9 23 NON - 13 10 25 12 Some argue that education affects health. Regress health on education, find the regression coefficient p and interpret. 9. Calculate the intercept for the regression in problem 8 and interpret. 10. From questions 8 and 9, construct the ANOVA table and interpret the results