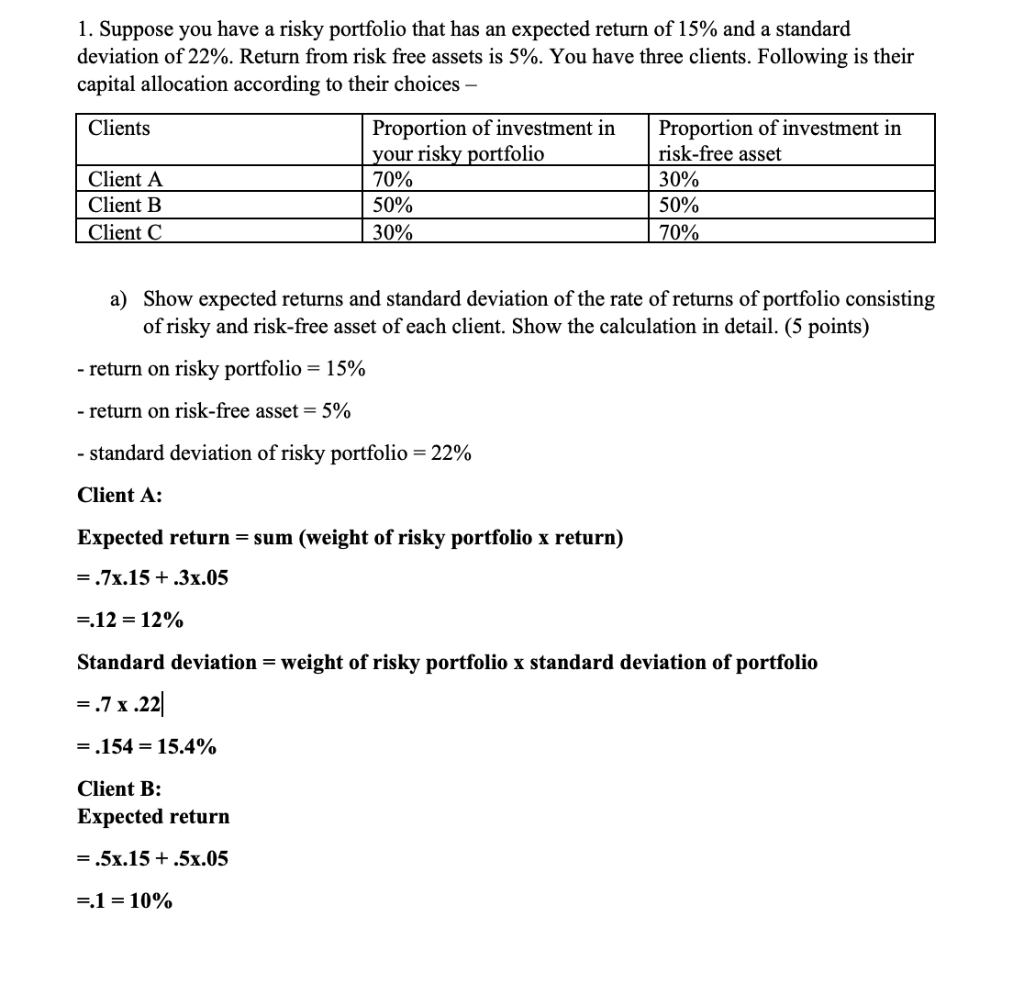
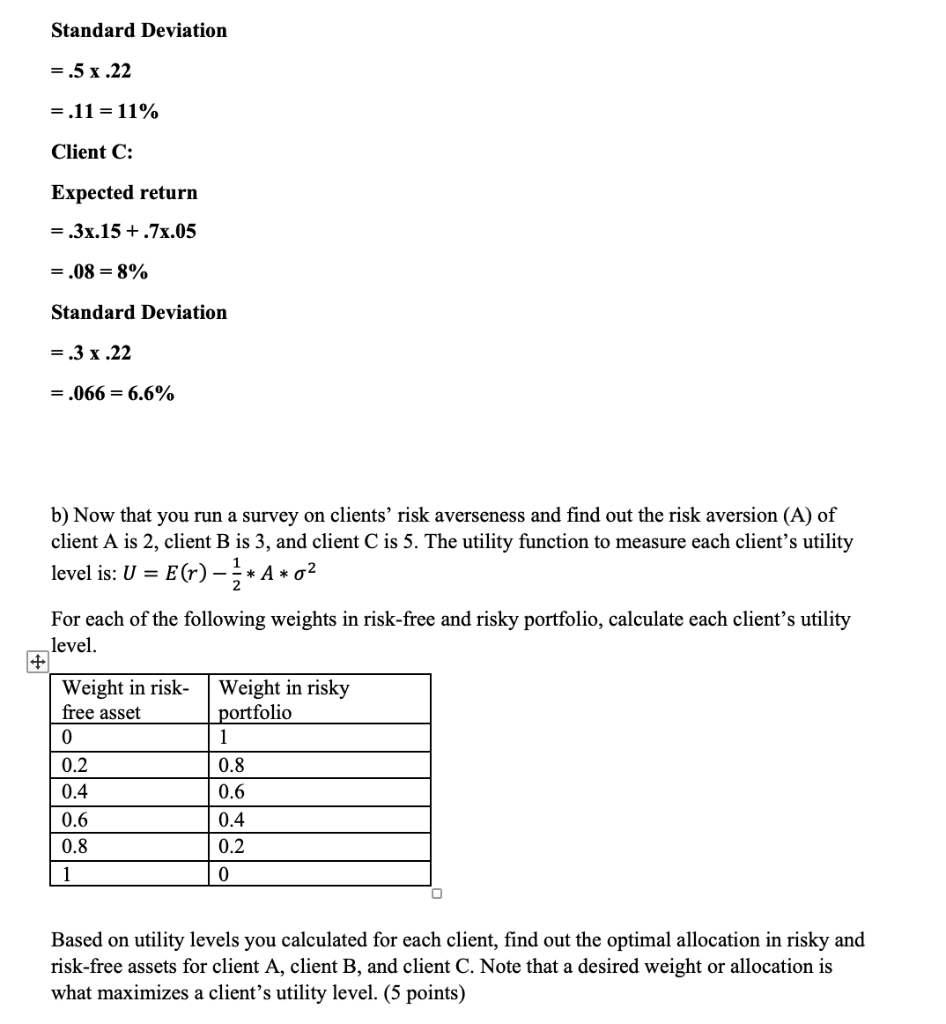
1. Suppose you have a risky portfolio that has an expected return of 15% and a standard deviation of 22%. Return from risk free assets is 5%. You have three clients. Following is their capital allocation according to their choices - a) Show expected returns and standard deviation of the rate of returns of portfolio consisting of risky and risk-free asset of each client. Show the calculation in detail. (5 points) - return on risky portfolio =15% - return on risk-free asset =5% - standard deviation of risky portfolio =22% Client A: Expected return = sum (weight of risky portfolio x return) =.7.15+.3x.05=.12=12% Standard deviation = weight of risky portfolio x standard deviation of portfolio =.7.22=.154=15.4% Client B: Expected return =.5.15+.5.05=.1=10% =.5.22=.11=11% Client C: Expected return =.3x.15+.7x.05=.08=8% Standard Deviation =.3.22=.066=6.6% b) Now that you run a survey on clients' risk averseness and find out the risk aversion (A) of client A is 2, client B is 3 , and client C is 5 . The utility function to measure each client's utility level is: U=E(r)21A2 For each of the following weights in risk-free and risky portfolio, calculate each client's utility level. Based on utility levels you calculated for each client, find out the optimal allocation in risky and risk-free assets for client A, client B, and client C. Note that a desired weight or allocation is what maximizes a client's utility level. (5 points) 1. Suppose you have a risky portfolio that has an expected return of 15% and a standard deviation of 22%. Return from risk free assets is 5%. You have three clients. Following is their capital allocation according to their choices - a) Show expected returns and standard deviation of the rate of returns of portfolio consisting of risky and risk-free asset of each client. Show the calculation in detail. (5 points) - return on risky portfolio =15% - return on risk-free asset =5% - standard deviation of risky portfolio =22% Client A: Expected return = sum (weight of risky portfolio x return) =.7.15+.3x.05=.12=12% Standard deviation = weight of risky portfolio x standard deviation of portfolio =.7.22=.154=15.4% Client B: Expected return =.5.15+.5.05=.1=10% =.5.22=.11=11% Client C: Expected return =.3x.15+.7x.05=.08=8% Standard Deviation =.3.22=.066=6.6% b) Now that you run a survey on clients' risk averseness and find out the risk aversion (A) of client A is 2, client B is 3 , and client C is 5 . The utility function to measure each client's utility level is: U=E(r)21A2 For each of the following weights in risk-free and risky portfolio, calculate each client's utility level. Based on utility levels you calculated for each client, find out the optimal allocation in risky and risk-free assets for client A, client B, and client C. Note that a desired weight or allocation is what maximizes a client's utility level. (5 points)