Answered step by step
Verified Expert Solution
Link Copied!

Question

1 Approved Answer

1) Suppose you want to test the hypothesis that there is a relationship between an element's atomic radius (in Angstroms) and how many protons it
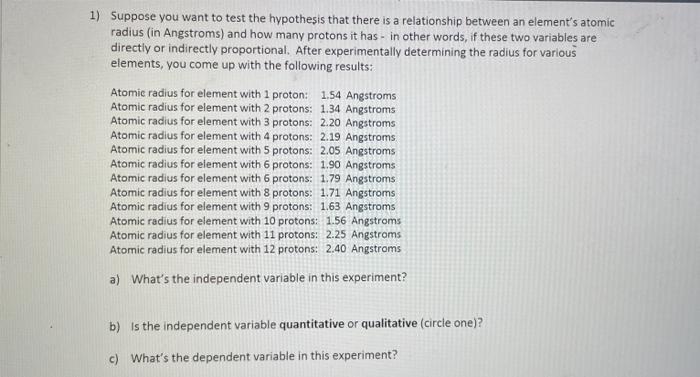
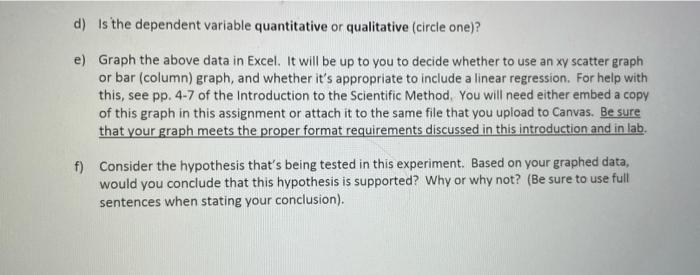
image text in transcribed
1) Suppose you want to test the hypothesis that there is a relationship between an element's atomic radius (in Angstroms) and how many protons it has - in other words, if these two variables are directly or indirectly proportional. After experimentally determining the radius for various elements, you come up with the following results: Atomic radius for element with 1 proton: 1.54 Angstroms Atomic radius for element with 2 protons: 1.34 Angstroms Atomic radius for element with 3 protons: 2.20 Angstroms Atomic radius for element with 4 protons: 2.19 Angstroms Atomic radius for element with 5 protons: 2.05 Angstroms Atomic radius for element with 6 protons: 1.90 Angstroms Atomic radius for element with 6 protons: 1.79 Angstroms Atomic radius for element with 8 protons: 1.71 Angstroms Atomic radius for element with 9 protons: 1.63 Angstroms Atomic radius for element with 10 protons: 1.56 Angstroms Atomic radius for element with 11 protons: 2.25 Angstroms Atomic radius for element with 12 protons: 2.40 Angstroms a) What's the independent variable in this experiment? b) is the independent variable quantitative or qualitative (circle one)? c) What's the dependent variable in this experiment? d) is the dependent variable quantitative or qualitative (circle one)? e) Graph the above data in Excel. It will be up to you to decide whether to use an xy scatter graph or bar (column) graph, and whether it's appropriate to include a linear regression. For help with this, see pp. 4-7 of the Introduction to the Scientific Method. You will need either embed a copy of this graph in this assignment or attach it to the same file that you upload to Canvas. Be sure that your graph meets the proper format requirements discussed in this introduction and in lab. f) Consider the hypothesis that's being tested in this experiment. Based on your graphed data, would you conclude that this hypothesis is supported? Why or why not? (Be sure to use full sentences when stating your conclusion)

Step by Step Solution

There are 3 Steps involved in it

Step: 1

blur-text-image

Get Instant Access to Expert-Tailored Solutions

See step-by-step solutions with expert insights and AI powered tools for academic success

Step: 2

blur-text-image

Step: 3

blur-text-image

Ace Your Homework with AI

Get the answers you need in no time with our AI-driven, step-by-step assistance

Get Started

Recommended Textbook for

Organic Chemistry

Authors: William H. Brown, Brent L. Iverson, Eric Anslyn, Christopher S. Foote

8th Edition

1305580354, 978-1305580350

More Books

Students also viewed these Chemistry questions