1) Table 4.1 is below. Note that the data is sorted by the first column from high to low inflation PP. Does the data in the table support the quantity theory of money (QTM) for all, some, or none of the countries listed?
2) From the top of page two of Table 4.1, calculate the change in velocity for Syria.
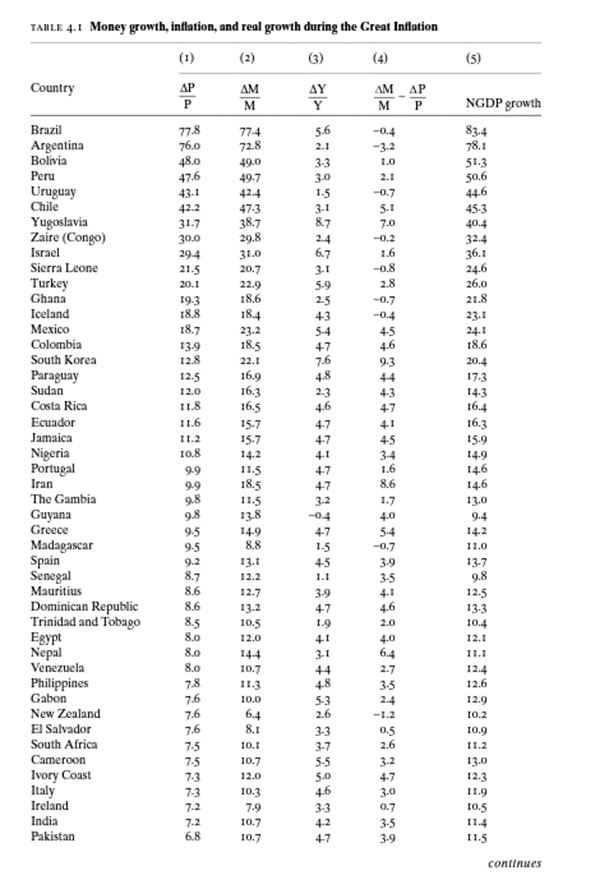
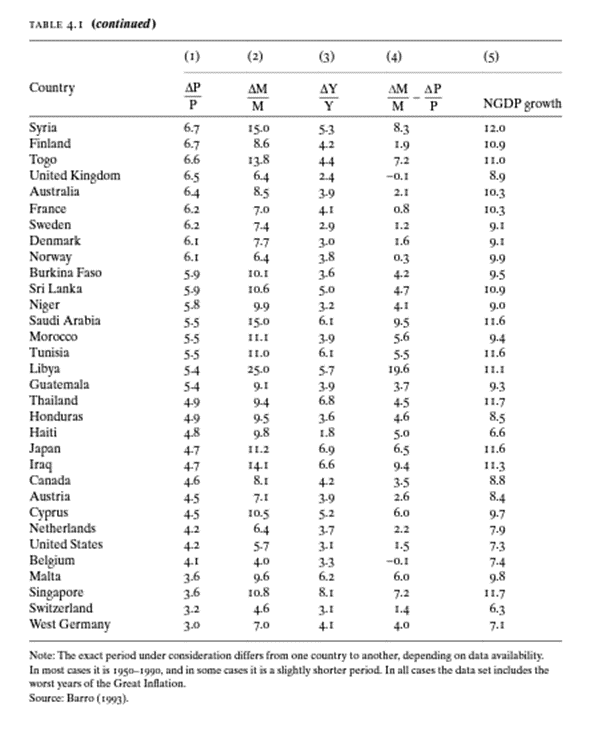
(5) 5.6 76.0 48.0 47.6 NGDP growth 83.4 78.1 51.3 50.6 1.0 44.6 31.0 3.1 45-3 40.4 32.4 36.1 24.6 26.0 21.8 23.1 24.1 18.6 20.4 17.3 14.3 16.4 16.3 15.9 14.9 14.6 4.6 44 TABLE 4.1 Money growth, inflation, and real growth during the Great Inflation (1) (2) Country AP AM AMAP P M Y Brazil 77.8 77-4 -0.4 Argentina 72.8 2.1 -3.2 Bolivia 49.0 3-3 Peru 49.7 3.0 2.1 Uruguay 43.1 42.4 1.5 -0.7 Chile 42.2 47-3 3.1 5.1 Yugoslavia 31.7 38.7 87 7.0 Zaire (Congo) 30.0 29.8 24 -0.2 Israel 29.4 6.7 1.6 Sierra Leone 21.5 20.7 -0.8 Turkey 20.1 22.9 5-9 2.8 Ghana 19-3 18.6 2.5 -0.7 Iceland 188 18.4 43 -0.4 Mexico 18.7 23.2 5-4 Colombia 4.5 13.9 18.5 47 South Korea 12.8 22.1 7.6 9.3 Paraguay 12.5 16.9 Sudan 12.0 16.3 4-3 Costa Rica 11.8 16.5 4.7 Ecuador 11.6 15.7 4.7 4.1 Jamaica II.2 15.7 Nigeria 10.8 14.2 4.1 3-4 Portugal 99 11.5 4.7 1.6 9.9 18.5 4.7 The Gambia 11.5 3.2 1.7 Guyana -0.4 4.0 Greece 5-4 Madagascar 9.5 8.8 1.5 -0.7 Spain 9.2 13.1 4-5 3.9 Senegal 8.7 12.2 1.1 3-5 Mauritius 8.6 12.7 3.9 4.1 Dominican Republic 8.6 13.2 Trinidad and Tobago 8.5 Egypt 8.0 12.0 4.1 4.0 Nepal 8.0 3.1 6.4 Venezuela 8.0 10.7 2.7 Philippines 78 11.3 4.8 Gabon 3.5 7.6 10.0 5-3 2.4 New Zealand 7.6 6.4 -1.2 El Salvador 8.1 3-3 0.5 South Africa 7.5 3-7 2.6 Cameroon 7.5 10.7 Ivory Coast 73 12.0 4.7 Italy 7-3 10.3 3.0 Ireland 7-2 7.9 3-3 0.7 India 4.2 3-5 Pakistan 6.8 4.7 3.9 4.8 23 4.6 4.7 45 Iran 8.6 14.6 9.8 9.8 9.5 13.8 14-9 4.7 4.7 4.6 13.0 9.4 14.2 11.0 13.7 9.8 12.5 13.3 10.4 12.1 11.1 12.4 12.6 12.9 10.2 10.9 10.5 1.9 2.0 14-4 2.6 7.6 10.1 3.2 5-5 5.0 4.6 13.0 12.3 11.9 10.5 7.2 10.7 10.7 11.5 continues TABLE 4.1 (continued) 83 3.8 3.6 5.0 5.9 0.3 4.2 4.7 4.1 9.5 9.0 3.9 5.6 5.5 (1) (3) (4) (5) Country AP AM AY AM AP P M Y MP NGDP growth Syria 6.7 15.0 5-3 12.0 Finland 6.7 8.6 4.2 1.9 10.9 Togo 6.6 13.8 44 7.2 11.0 United Kingdom 6.5 6.4 2.4 -0.1 8.9 Australia 64 8.5 3-9 2.1 10.3 France 6.2 7.0 4.1 0.8 10.3 Sweden 6.2 7.4 2.9 1.2 9.1 Denmark 6.1 3.0 1.6 9.1 Norway 6.1 6.4 9.9 Burkina Faso 5.9 10.1 9.5 Sri Lanka 10.6 10.9 Niger 5.8 9.9 3.2 Saudi Arabia 5.5 15.0 6.1 11.6 Morocco 5.5 11.I 9.4 Tunisia 5-5 11.0 6.1 11.6 Libya 54 25.0 19.6 11.1 Guatemala 54 9.1 Thailand 4-9 9-4 6.8 11.7 Honduras 4.9 9.5 3.6 8.5 Haiti 4.8 9.8 1.8 6.6 Japan 4.7 11.2 6.9 6.5 11.6 4.7 14.1 9.4 11.3 Canada 4.6 4.2 3-5 8.8 Austria 45 7.1 3.9 2.6 8.4 Cyprus 4-5 10.5 5.2 6.0 9.7 Netherlands 4.2 6.4 3-7 2.2 7.9 United States 4.2 5-7 3.1 1.5 7-3 Belgium 4.0 -0.1 7.4 Malta 9.6 6.2 9.8 Singapore 10.8 8.1 7.2 11.7 Switzerland 3.2 4.6 3.1 1.4 6.3 West Germany 3.0 7.0 4.1 4.0 7.1 Note: The exact period under consideration differs from one country to another, depending on data availability In most cases it is 1950-1990, and in some cases it is a slightly shorter period. In all cases the data set includes the wurst years of the Great Inflation. Source: Barro (1983). 5-7 3.9 3.7 9.3 4-5 4.6 5.0 Irag 6.6 8.1 4.1 3.6 3.6 6.0 (5) 5.6 76.0 48.0 47.6 NGDP growth 83.4 78.1 51.3 50.6 1.0 44.6 31.0 3.1 45-3 40.4 32.4 36.1 24.6 26.0 21.8 23.1 24.1 18.6 20.4 17.3 14.3 16.4 16.3 15.9 14.9 14.6 4.6 44 TABLE 4.1 Money growth, inflation, and real growth during the Great Inflation (1) (2) Country AP AM AMAP P M Y Brazil 77.8 77-4 -0.4 Argentina 72.8 2.1 -3.2 Bolivia 49.0 3-3 Peru 49.7 3.0 2.1 Uruguay 43.1 42.4 1.5 -0.7 Chile 42.2 47-3 3.1 5.1 Yugoslavia 31.7 38.7 87 7.0 Zaire (Congo) 30.0 29.8 24 -0.2 Israel 29.4 6.7 1.6 Sierra Leone 21.5 20.7 -0.8 Turkey 20.1 22.9 5-9 2.8 Ghana 19-3 18.6 2.5 -0.7 Iceland 188 18.4 43 -0.4 Mexico 18.7 23.2 5-4 Colombia 4.5 13.9 18.5 47 South Korea 12.8 22.1 7.6 9.3 Paraguay 12.5 16.9 Sudan 12.0 16.3 4-3 Costa Rica 11.8 16.5 4.7 Ecuador 11.6 15.7 4.7 4.1 Jamaica II.2 15.7 Nigeria 10.8 14.2 4.1 3-4 Portugal 99 11.5 4.7 1.6 9.9 18.5 4.7 The Gambia 11.5 3.2 1.7 Guyana -0.4 4.0 Greece 5-4 Madagascar 9.5 8.8 1.5 -0.7 Spain 9.2 13.1 4-5 3.9 Senegal 8.7 12.2 1.1 3-5 Mauritius 8.6 12.7 3.9 4.1 Dominican Republic 8.6 13.2 Trinidad and Tobago 8.5 Egypt 8.0 12.0 4.1 4.0 Nepal 8.0 3.1 6.4 Venezuela 8.0 10.7 2.7 Philippines 78 11.3 4.8 Gabon 3.5 7.6 10.0 5-3 2.4 New Zealand 7.6 6.4 -1.2 El Salvador 8.1 3-3 0.5 South Africa 7.5 3-7 2.6 Cameroon 7.5 10.7 Ivory Coast 73 12.0 4.7 Italy 7-3 10.3 3.0 Ireland 7-2 7.9 3-3 0.7 India 4.2 3-5 Pakistan 6.8 4.7 3.9 4.8 23 4.6 4.7 45 Iran 8.6 14.6 9.8 9.8 9.5 13.8 14-9 4.7 4.7 4.6 13.0 9.4 14.2 11.0 13.7 9.8 12.5 13.3 10.4 12.1 11.1 12.4 12.6 12.9 10.2 10.9 10.5 1.9 2.0 14-4 2.6 7.6 10.1 3.2 5-5 5.0 4.6 13.0 12.3 11.9 10.5 7.2 10.7 10.7 11.5 continues TABLE 4.1 (continued) 83 3.8 3.6 5.0 5.9 0.3 4.2 4.7 4.1 9.5 9.0 3.9 5.6 5.5 (1) (3) (4) (5) Country AP AM AY AM AP P M Y MP NGDP growth Syria 6.7 15.0 5-3 12.0 Finland 6.7 8.6 4.2 1.9 10.9 Togo 6.6 13.8 44 7.2 11.0 United Kingdom 6.5 6.4 2.4 -0.1 8.9 Australia 64 8.5 3-9 2.1 10.3 France 6.2 7.0 4.1 0.8 10.3 Sweden 6.2 7.4 2.9 1.2 9.1 Denmark 6.1 3.0 1.6 9.1 Norway 6.1 6.4 9.9 Burkina Faso 5.9 10.1 9.5 Sri Lanka 10.6 10.9 Niger 5.8 9.9 3.2 Saudi Arabia 5.5 15.0 6.1 11.6 Morocco 5.5 11.I 9.4 Tunisia 5-5 11.0 6.1 11.6 Libya 54 25.0 19.6 11.1 Guatemala 54 9.1 Thailand 4-9 9-4 6.8 11.7 Honduras 4.9 9.5 3.6 8.5 Haiti 4.8 9.8 1.8 6.6 Japan 4.7 11.2 6.9 6.5 11.6 4.7 14.1 9.4 11.3 Canada 4.6 4.2 3-5 8.8 Austria 45 7.1 3.9 2.6 8.4 Cyprus 4-5 10.5 5.2 6.0 9.7 Netherlands 4.2 6.4 3-7 2.2 7.9 United States 4.2 5-7 3.1 1.5 7-3 Belgium 4.0 -0.1 7.4 Malta 9.6 6.2 9.8 Singapore 10.8 8.1 7.2 11.7 Switzerland 3.2 4.6 3.1 1.4 6.3 West Germany 3.0 7.0 4.1 4.0 7.1 Note: The exact period under consideration differs from one country to another, depending on data availability In most cases it is 1950-1990, and in some cases it is a slightly shorter period. In all cases the data set includes the wurst years of the Great Inflation. Source: Barro (1983). 5-7 3.9 3.7 9.3 4-5 4.6 5.0 Irag 6.6 8.1 4.1 3.6 3.6 6.0