

Question
1. Table below shows costs and effectiveness of five health intervention projects. Use project A as the reference project and find incremental costs and incremental
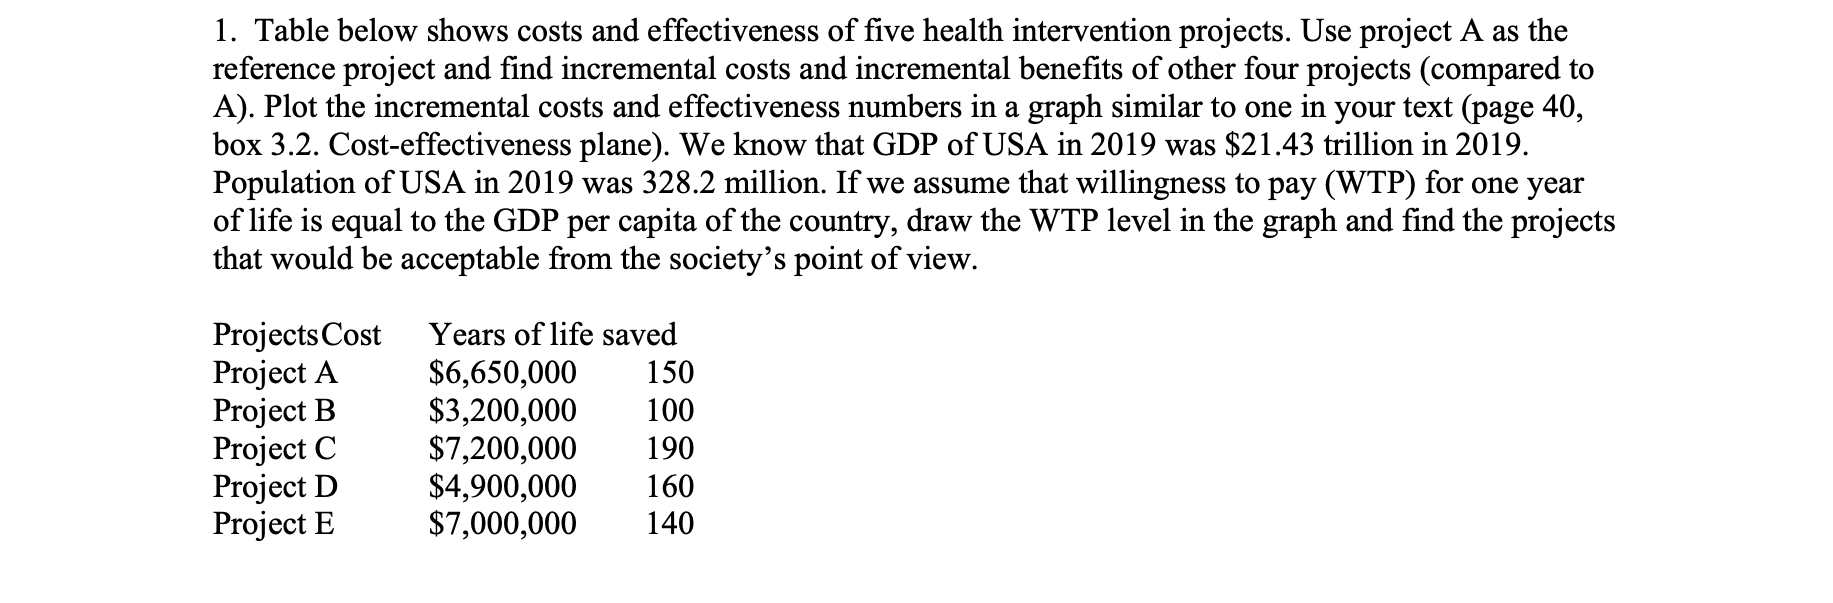 1. Table below shows costs and effectiveness of five health intervention projects. Use project A as the reference project and find incremental costs and incremental benefits of other four projects (compared to A). Plot the incremental costs and effectiveness numbers in a graph similar to one in your text (page 40, box 3.2. Cost-effectiveness plane). We know that GDP of USA in 2019 was $21.43 trillion in 2019. Population of USA in 2019 was 328.2 million. If we assume that willingness to pay (WTP) for one year of life is equal to the GDP per capita of the country, draw the WTP level in the graph and find the projects that would be acceptable from the societys point of view. ProjectsCost Years of life saved Project A $6,650,000 150 Project B $3,200,000 100 Project C $7,200,000 190 Project D $4,900,000 160 Project E $7,000,000 140
1. Table below shows costs and effectiveness of five health intervention projects. Use project A as the reference project and find incremental costs and incremental benefits of other four projects (compared to A). Plot the incremental costs and effectiveness numbers in a graph similar to one in your text (page 40 , box 3.2. Cost-effectiveness plane). We know that GDP of USA in 2019 was $21.43 trillion in 2019. Population of USA in 2019 was 328.2 million. If we assume that willingness to pay (WTP) for one year of life is equal to the GDP per capita of the country, draw the WTP level in the graph and find the projects that would be acceptable from the society's point of view. 1. Table below shows costs and effectiveness of five health intervention projects. Use project A as the reference project and find incremental costs and incremental benefits of other four projects (compared to A). Plot the incremental costs and effectiveness numbers in a graph similar to one in your text (page 40 , box 3.2. Cost-effectiveness plane). We know that GDP of USA in 2019 was $21.43 trillion in 2019. Population of USA in 2019 was 328.2 million. If we assume that willingness to pay (WTP) for one year of life is equal to the GDP per capita of the country, draw the WTP level in the graph and find the projects that would be acceptable from the society's point of view
Step by Step Solution
There are 3 Steps involved in it
Step: 1

Get Instant Access to Expert-Tailored Solutions
See step-by-step solutions with expert insights and AI powered tools for academic success
Step: 2

Step: 3
Ace Your Homework with AI
Get the answers you need in no time with our AI-driven, step-by-step assistance
Get Started
Audit Proofing Your Return
Authors: Jr. Wade, Jack Warren
1st Edition
002622240X, 978-0026222402