

Question
1) Test hypothesis that 70% of students use American cars. 2) Test hypothesis that less than 40% of students use Japanese cars. 3) Test hypothesis
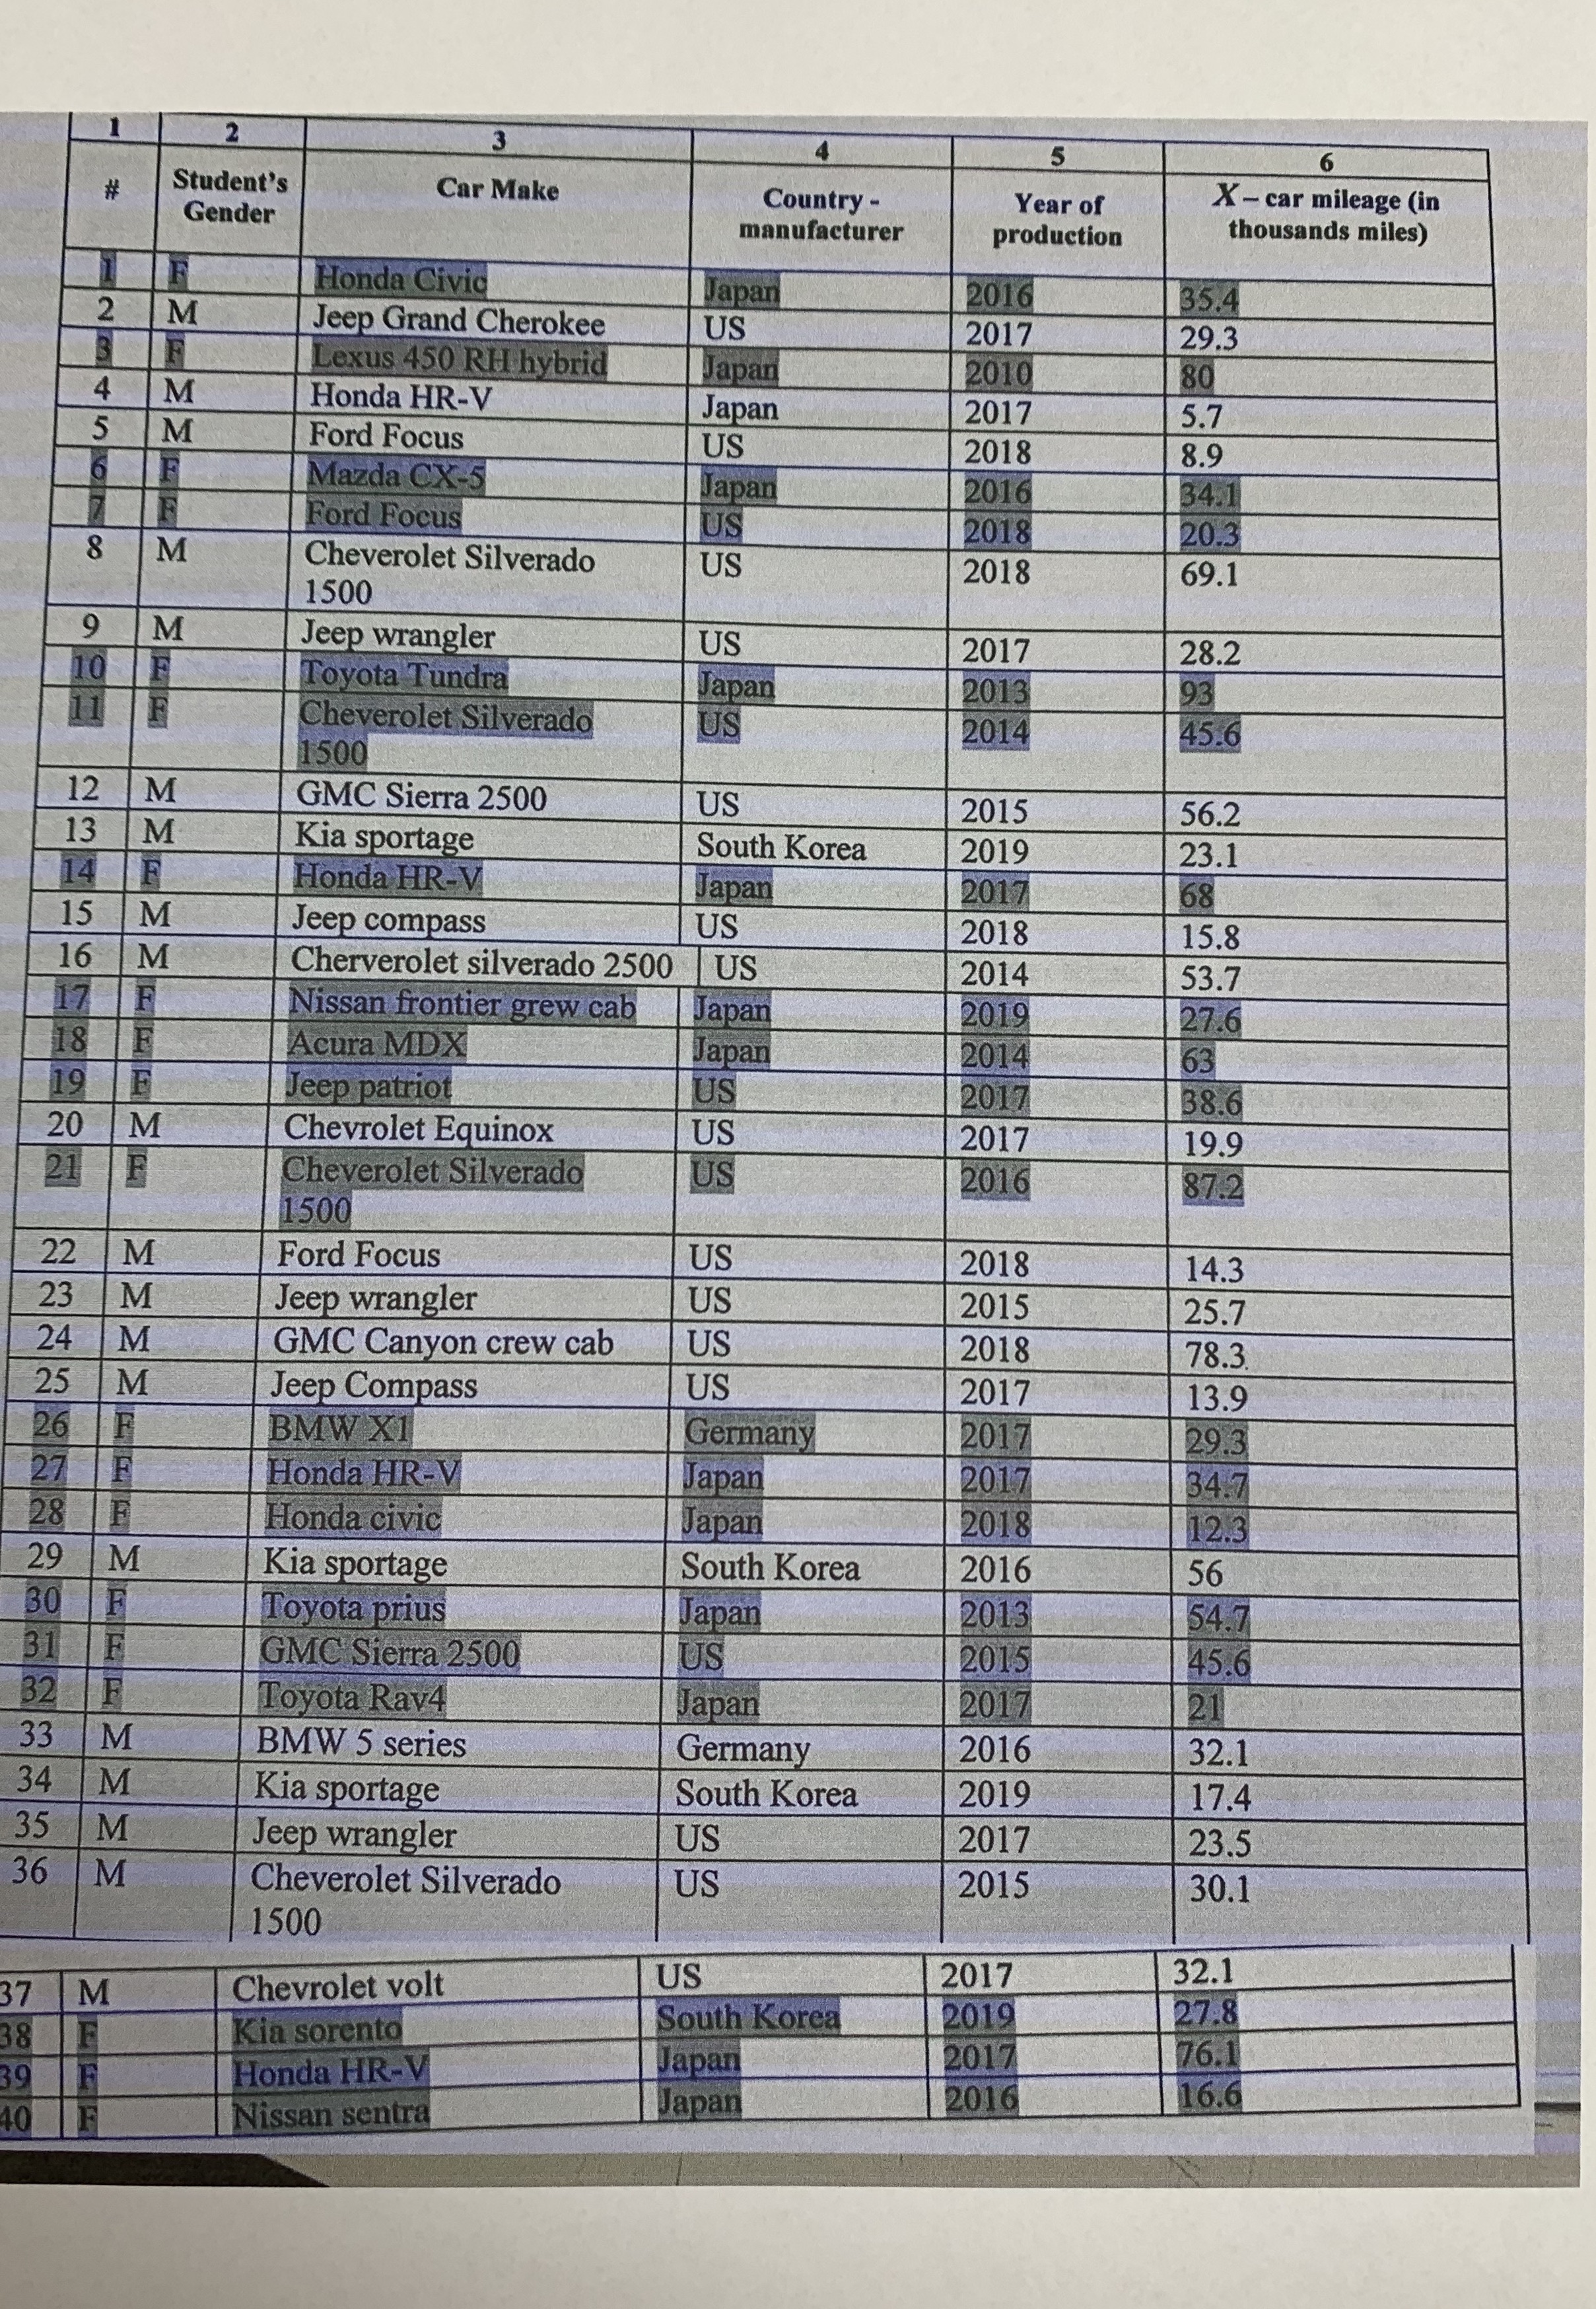
1) Test hypothesis that 70% of students use American cars. 2) Test hypothesis that less than 40% of students use Japanese cars. 3) Test hypothesis that average mileage of students' cars is greater than 50,000. Assume that standard deviation of mileage is known and equal to 40,000. What statistic do you use? 4) Test hypothesis that average mileage of students' cars is greater than 80,000 on the base of the sample you have. What statistic do you use? 5) Test hypothesis that standard deviation of mileage is 40,000. What statistic do you use? 6) Test hypothesis that average mileage of male students' cars is greater than average mileage of female students' cars. What statistic do you use? 7) What does it mean P-value?
Step by Step Solution
There are 3 Steps involved in it
Step: 1

Get Instant Access to Expert-Tailored Solutions
See step-by-step solutions with expert insights and AI powered tools for academic success
Step: 2

Step: 3
Ace Your Homework with AI
Get the answers you need in no time with our AI-driven, step-by-step assistance
Get Started
Numerical Analysis
Authors: Richard L. Burden, J. Douglas Faires
9th edition
538733519, 978-1133169338, 1133169333, 978-0538733519