Answered step by step
Verified Expert Solution
Link Copied!

Question

1 Approved Answer

1. The data set SwissBankNotes consists of six variables measured on 200 Swiss banknotes. The first 100 are genuine and the last 100 are counterfeit.
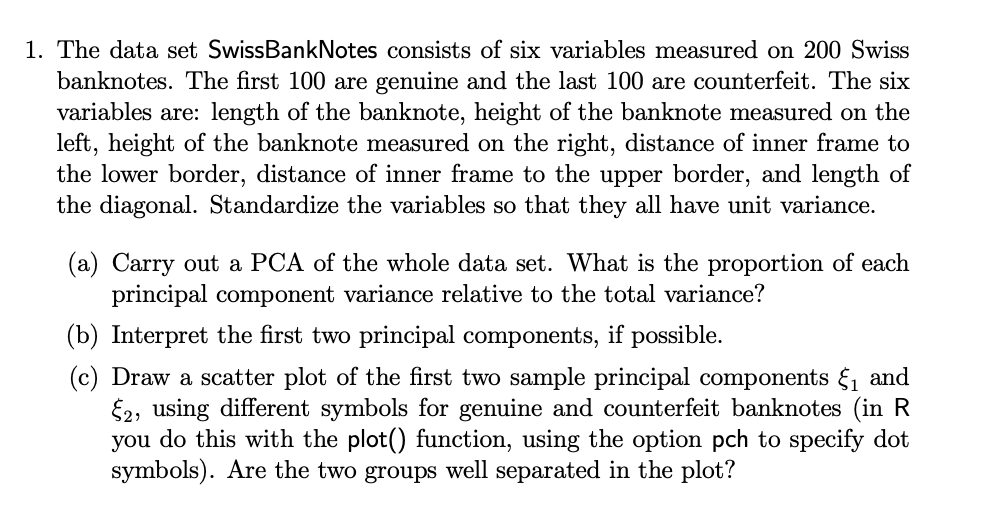
image text in transcribed

1. The data set SwissBankNotes consists of six variables measured on 200 Swiss banknotes. The first 100 are genuine and the last 100 are counterfeit. The six variables are: length of the banknote, height of the banknote measured on the left, height of the banknote measured on the right, distance of inner frame to the lower border, distance of inner frame to the upper border, and length of the diagonal. Standardize the variables so that they all have unit variance. (a) Carry out a PCA of the whole data set. What is the proportion of each principal component variance relative to the total variance? (b) Interpret the first two principal components, if possible. (c) Draw a scatter plot of the first two sample principal components &i and 2, using different symbols for genuine and counterfeit banknotes (in R you do this with the plot() function, using the option pch to specify dot symbols). Are the two groups well separated in the plot? 1. The data set SwissBankNotes consists of six variables measured on 200 Swiss banknotes. The first 100 are genuine and the last 100 are counterfeit. The six variables are: length of the banknote, height of the banknote measured on the left, height of the banknote measured on the right, distance of inner frame to the lower border, distance of inner frame to the upper border, and length of the diagonal. Standardize the variables so that they all have unit variance. (a) Carry out a PCA of the whole data set. What is the proportion of each principal component variance relative to the total variance? (b) Interpret the first two principal components, if possible. (c) Draw a scatter plot of the first two sample principal components &i and 2, using different symbols for genuine and counterfeit banknotes (in R you do this with the plot() function, using the option pch to specify dot symbols). Are the two groups well separated in the plot

Step by Step Solution

There are 3 Steps involved in it

Step: 1

blur-text-image

Get Instant Access to Expert-Tailored Solutions

See step-by-step solutions with expert insights and AI powered tools for academic success

Step: 2

blur-text-image

Step: 3

blur-text-image

Ace Your Homework with AI

Get the answers you need in no time with our AI-driven, step-by-step assistance

Get Started

Recommended Textbook for

Financial Pricing Models In Continuous Time And Kalman Filtering

Authors: B.Philipp Kellerhals

1st Edition

3540423648, 3662219018, 9783540423645, 9783662219010

More Books

Students also viewed these Finance questions