Question
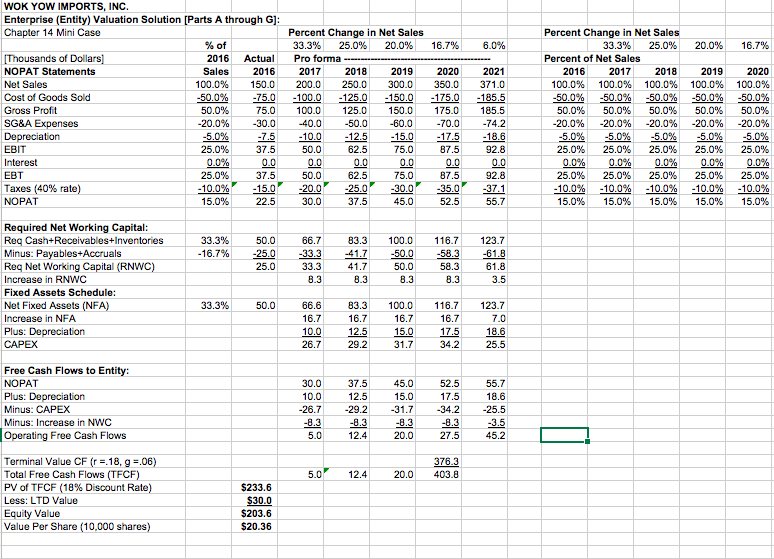
1.) The DCF valuation and pro forma financials with five years of forecasted growth rates are provided in the original model. Please modify the model

1.) The DCF valuation and pro forma financials with five years of forecasted growth rates are provided in the original model. Please modify the model to consider a more successful scenario where Wok Yows sales grow at a more aggressive pace of 40% for five years and then flatten to a more sustainable growth rate of 7%. What would the stock value per share be under the new scenario? What kind of strategic changes you would make in the business model to justify the growth assumption? How would you do things differently? You can use fictional events to justify your assumptions.
WOK YOW IMPORTS, INC. Enterprise (Entity) Valuation Solution [Parts A through G Chapter 14 Mini Case Percent Change in Net Sales 25.0% Percent Change in Net Sales 33.3% 20.0% 16.7% 6.0% %of 2016 Actual Pro forma 33.3% 25.0% 20.0% 16.7% Thousands of Dollars NOPAT Statements Net Sales Cost of Goods Sold Gross Proft SG&A Expenses Depreciation EBIT Percent of Net Sales Sales2016 20172018 2019 20202021 100.0% 150.0 200.0 250.0 300.0 350.0 371.0 2016 20172018 2019 2020 100.0% 100.0% 100.0% 100.0% 100.0% 50.0% -20.0% -5.0% 25.0% 0.0% 25.0% % 15.0% 50.0% -20.0% -5.0% 25.0% 0.0% 25.0% -10.0% 15.0% 50.0% -20.0% -5.0% 25.0% 0.0% 25.0% -10.0% 15.0% 75.0100.0 125.0 150.0175.0 185.5 50.0% -20.0% -5.0% 25.0% 0.0% 25.0% -10.0% 15.0% 50.0% 50.0% -20.0% -5.0% 25.0% 0.0% 25.0% -10.0% 15.0% -20.0% -30.0-40.0-50.0-60.0 70.0 -5.0% -7.5-1 25.0% 37.5 50.0 62.5 75.0 87.5 92.8 0.0% 0.0 0.0 0.0 0.0 0.0 0.0 EBT Taxes (40% rate NOPAT 92.8 15.0% 45.0 Required Net Working Capital Req Cash+Receivables+Inventories Minus: Payables+Accruals Req Net Working Capital (RNWC) Increase in RNWC Fixed Assets Schedule: Net Fixed Assets (NFA Increase in NFA Plus: Depreciation 33.3% 50.0 66.7 83.3 100.0 116.7 123.7 16.7% -33.3 7 50.0 5.361.8 33.3% 50.0 66.6 83.3 100.0 116.7 123.7 10.0 125 15.0 17.5 18.6 26.729.2317 34.2 25.5 Free Cash Flows to Entity NOPAT Plus: Depreciation Minus: CAPEX Minus: Increase in NWC Operating Free Cash Flows 45.0 2 17.5 26.7 9.231.734.2 -25.5 8.3 -8.3 8.3 -8.3 3.5 5.0 12.420.027.545.2 Terminal Value CF (r.18,g.06) Total Free Cash Flows (TFCF PV of TFCF (18% Discount Rate) Less: LTD Value Equity Value Value Per Share (10,000 shares 5.012.420.0403.8 233.6 3 $20.36Step by Step Solution
There are 3 Steps involved in it
Step: 1

Get Instant Access to Expert-Tailored Solutions
See step-by-step solutions with expert insights and AI powered tools for academic success
Step: 2

Step: 3

Ace Your Homework with AI
Get the answers you need in no time with our AI-driven, step-by-step assistance
Get Started


