

Answered step by step
Verified Expert Solution
Question
1 Approved Answer
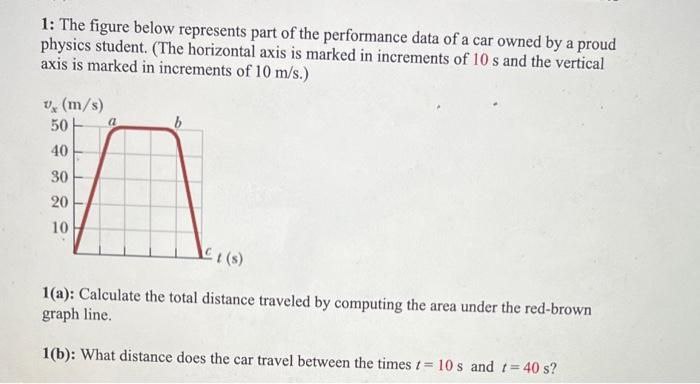
1: The figure below represents part of the performance data of a car owned by a proud physics student. (The horizontal axis is marked in
Step by Step Solution
There are 3 Steps involved in it
Step: 1

Get Instant Access to Expert-Tailored Solutions
See step-by-step solutions with expert insights and AI powered tools for academic success
Step: 2

Step: 3
Ace Your Homework with AI
Get the answers you need in no time with our AI-driven, step-by-step assistance
Get Started
Introductory Classical Mechanics
Authors: David Morin
1st edition
9780511808951, 521876222, 978-0521876223