Answered step by step
Verified Expert Solution
Link Copied!

Question

1 Approved Answer

1. The figure below shows a 17-month study of disease A in 11 individuals. Please refer to the figure to answer questions. 1 2 3
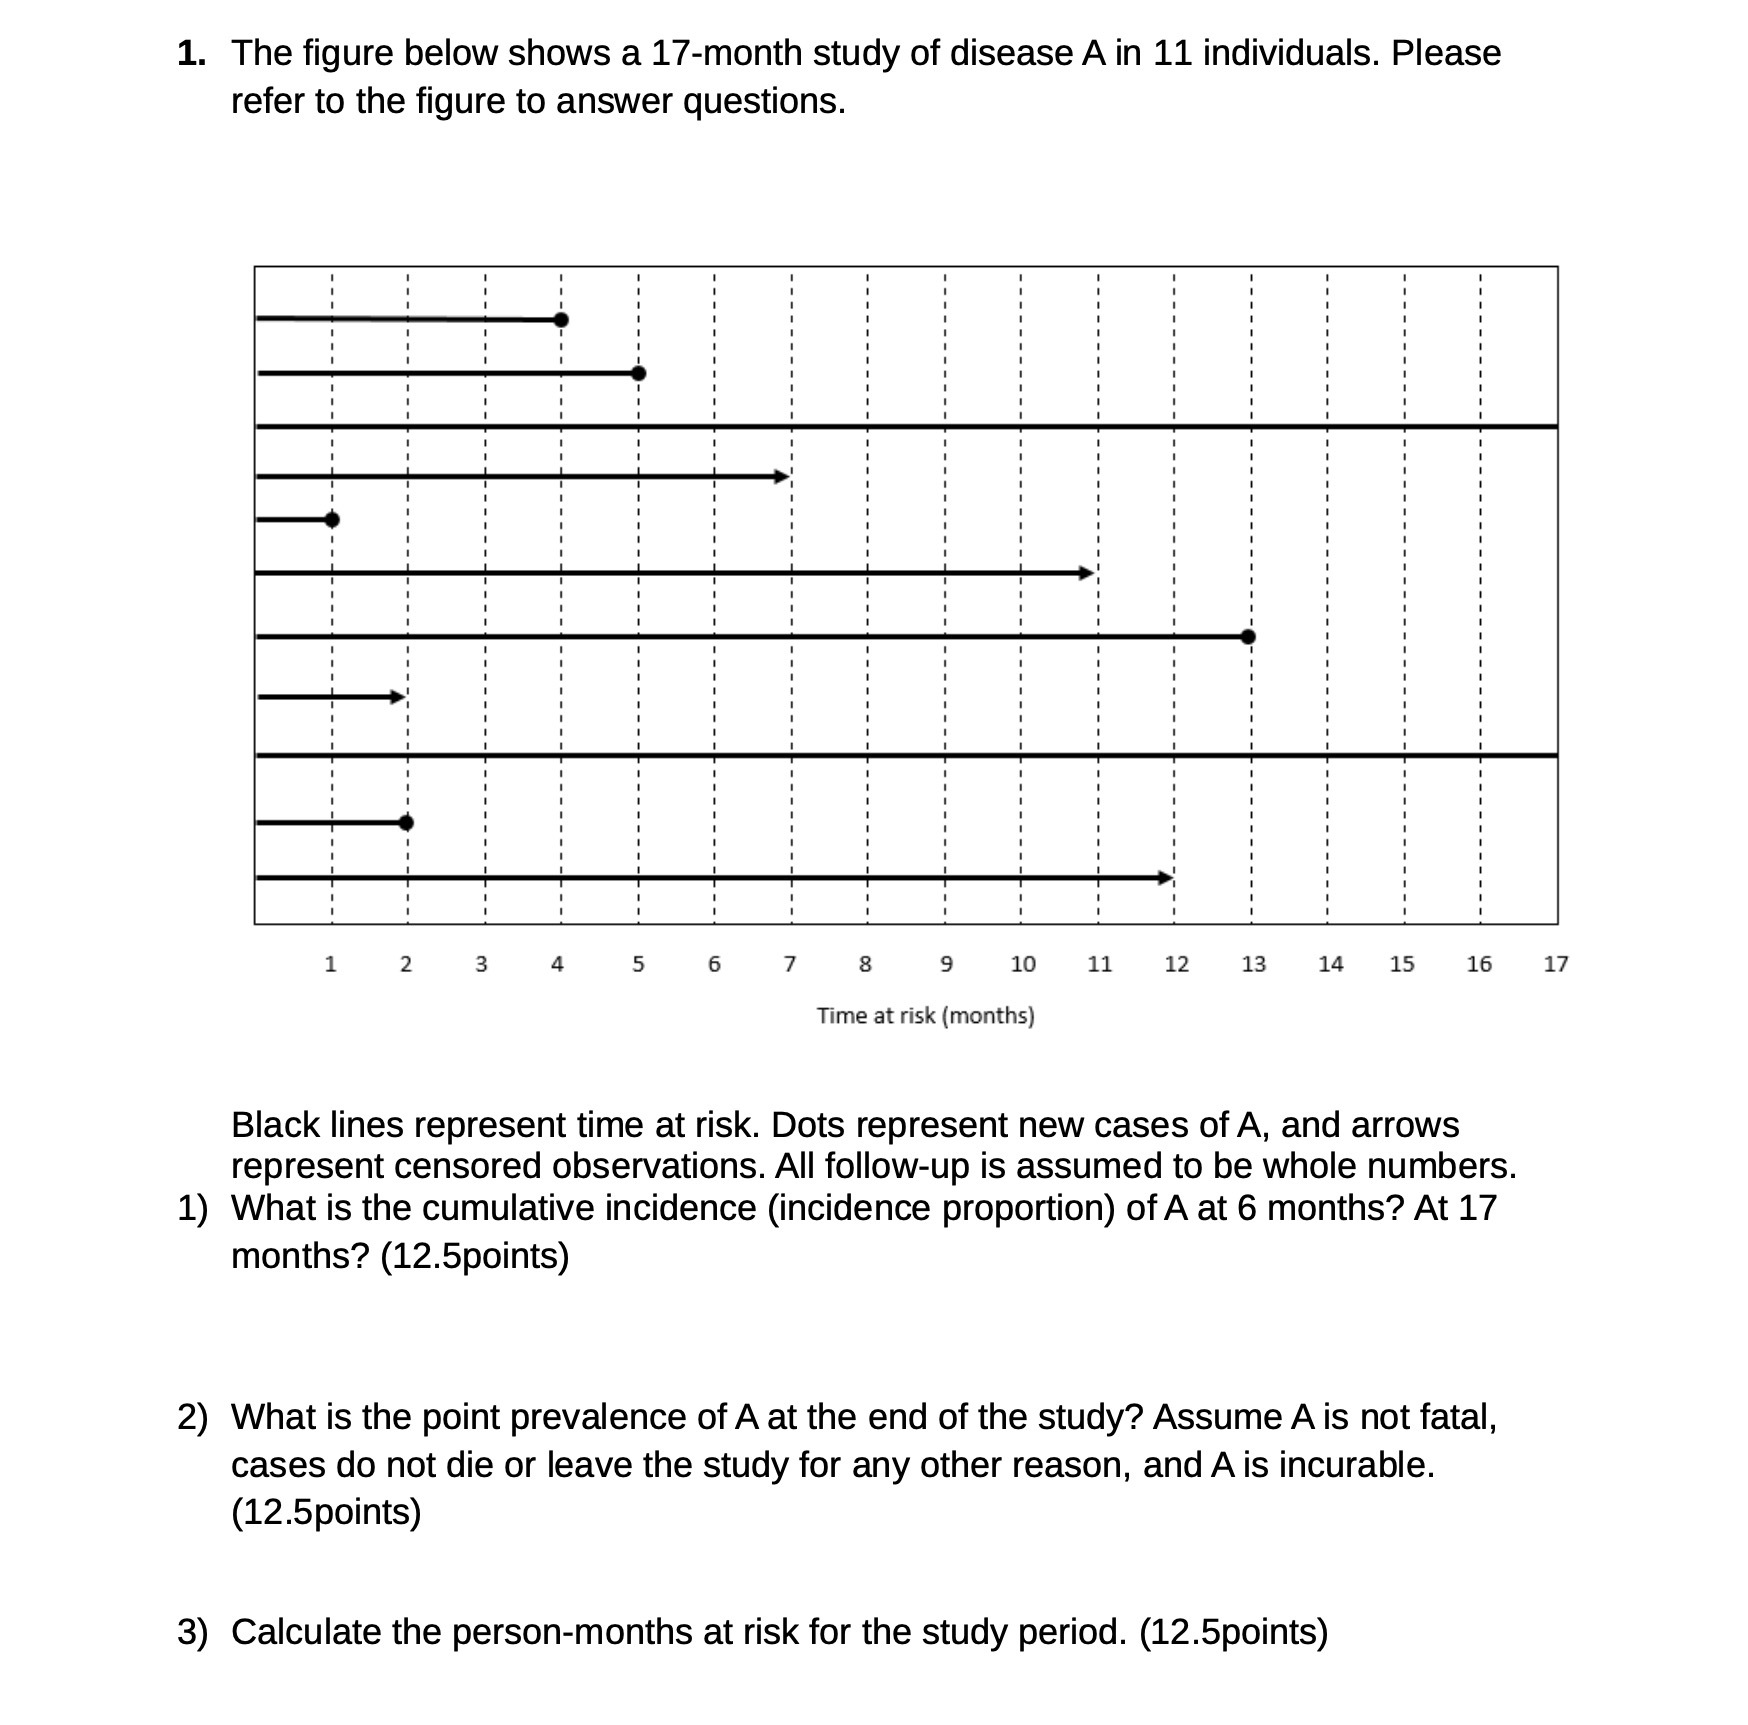
image text in transcribed
1. The figure below shows a 17-month study of disease A in 11 individuals. Please refer to the figure to answer questions. 1 2 3 4 5 6 7 8 9 10 11 12 13 14 15 16 17 Time at risk (months) Black lines represent time at risk. Dots represent new cases of A, and arrows represent censored observations. All follow-up is assumed to be whole numbers. 1) What is the cumulative incidence (incidence proportion) ofA at 6 months? At 17 months? (12.5points) 2) What is the point prevalence ofA at the end of the study? Assume A is not fatal, cases do not die or leave the study for any other reason, and A is incurable. (12.5points) 3) Calculate the person-months at risk for the study period. (12.5points)

Step by Step Solution

There are 3 Steps involved in it

Step: 1

blur-text-image

Get Instant Access to Expert-Tailored Solutions

See step-by-step solutions with expert insights and AI powered tools for academic success

Step: 2

blur-text-image

Step: 3

blur-text-image

Ace Your Homework with AI

Get the answers you need in no time with our AI-driven, step-by-step assistance

Get Started

Recommended Textbook for

Advanced Engineering Mathematics

Authors: ERWIN KREYSZIG

9th Edition

0471488852, 978-0471488859

More Books

Students also viewed these Mathematics questions

Question

3. How could burnout have a good side? What may be a benefit?

Answered: 1 week ago