Question
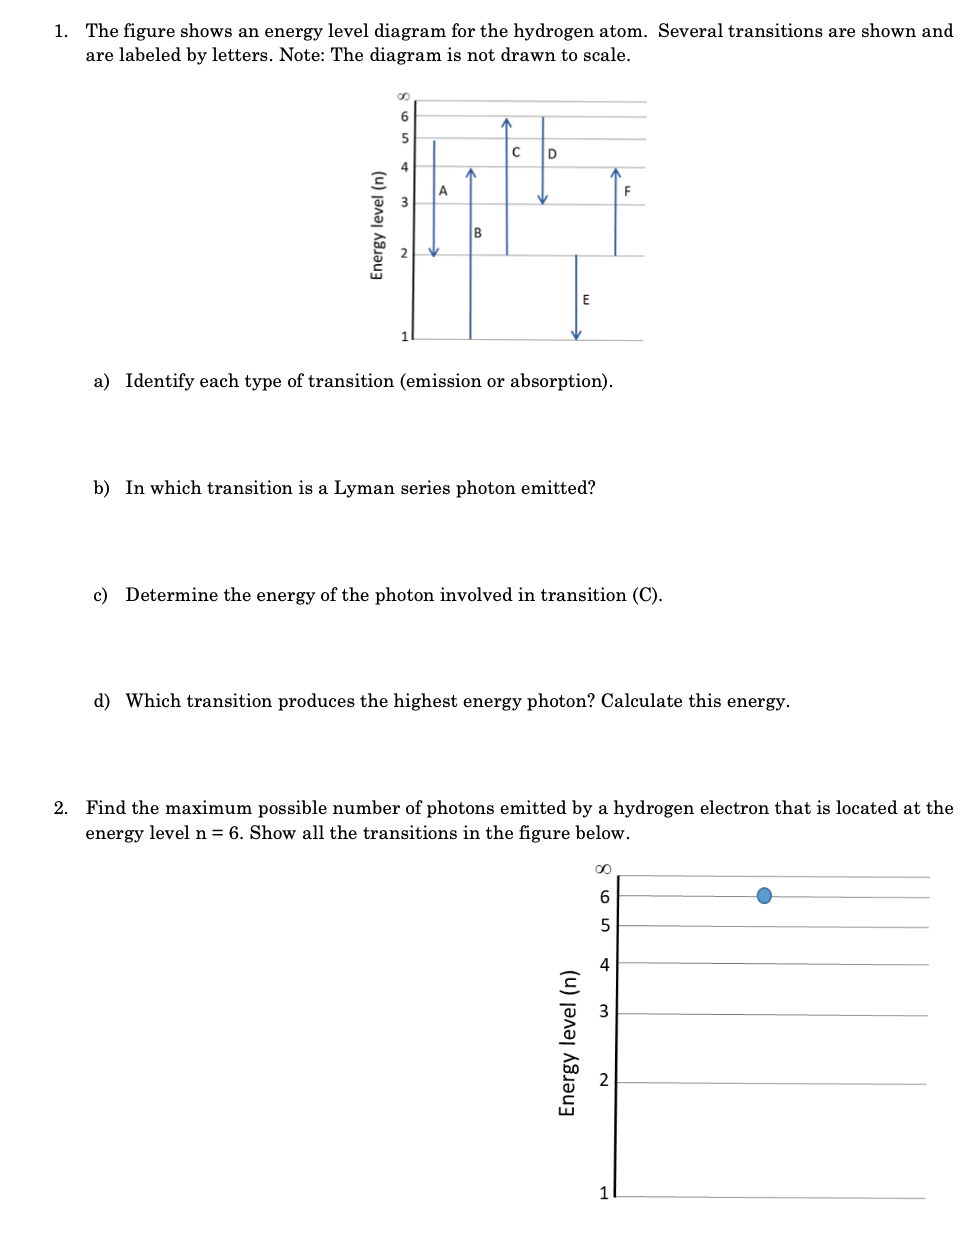
1. The figure shows an energy level diagram for the hydrogen atom. Several transitions are shown and are labeled by letters. Note: The diagram

1. The figure shows an energy level diagram for the hydrogen atom. Several transitions are shown and are labeled by letters. Note: The diagram is not drawn to scale. 5 C D 4 A 14 B E Energy level (n) 6 a) Identify each type of transition (emission or absorption). b) In which transition is a Lyman series photon emitted? c) Determine the energy of the photon involved in transition (C). d) Which transition produces the highest energy photon? Calculate this energy. F 2. Find the maximum possible number of photons emitted by a hydrogen electron that is located at the energy level n = 6. Show all the transitions in the figure below. Energy level (n) 0 6 5 4
Step by Step Solution
3.29 Rating (143 Votes )
There are 3 Steps involved in it
Step: 1

Get Instant Access to Expert-Tailored Solutions
See step-by-step solutions with expert insights and AI powered tools for academic success
Step: 2

Step: 3

Ace Your Homework with AI
Get the answers you need in no time with our AI-driven, step-by-step assistance
Get StartedRecommended Textbook for
Physics
Authors: Alan Giambattista, Betty Richardson, Robert Richardson
2nd edition
77339681, 978-0077339685
Students also viewed these Physics questions
Question
Answered: 1 week ago
Question
Answered: 1 week ago
Question
Answered: 1 week ago
Question
Answered: 1 week ago
Question
Answered: 1 week ago
Question
Answered: 1 week ago
Question
Answered: 1 week ago
Question
Answered: 1 week ago
Question
Answered: 1 week ago
Question
Answered: 1 week ago
Question
Answered: 1 week ago
Question
Answered: 1 week ago
Question
Answered: 1 week ago
Question
Answered: 1 week ago
Question
Answered: 1 week ago
Question
Answered: 1 week ago
Question
Answered: 1 week ago
Question
Answered: 1 week ago
Question
Answered: 1 week ago
Question
Answered: 1 week ago
View Answer in SolutionInn App


