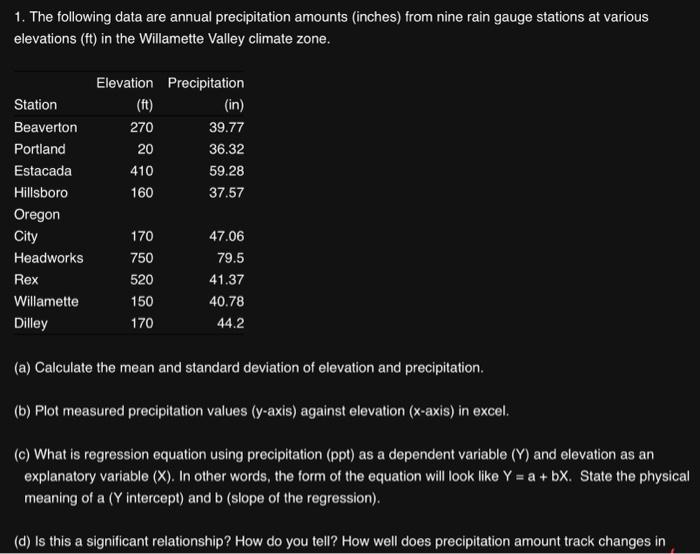
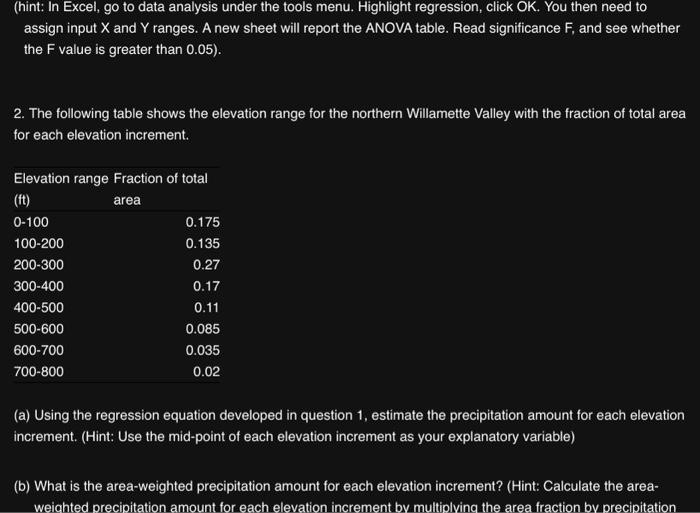
1. The following data are annual precipitation amounts (inches) from nine rain gauge stations at various elevations ( ft ) in the Willamette Valley climate zone. (a) Calculate the mean and standard deviation of elevation and precipitation. (b) Plot measured precipitation values ( y-axis) against elevation ( x-axis) in excel. (c) What is regression equation using precipitation ( ppt ) as a dependent variable (Y) and elevation as an explanatory variable (X). In other words, the form of the equation will look like Y=a+bX. State the physical meaning of a(Y intercept) and b (slope of the regression). (c) What is the precipitation amount for the area using this method, so called the hypsometric method? (d) Compare your results in 2(c) with the mean precipitation amount estimated in the previous question 1 (a). Are they different? Why or why not? (e) Discuss the pros and cons of using these two methods? If there is an alternative way of estimating basinwide precipitation, please describe the alternative method. (hint: In Excel, go to data analysis under the tools menu. Highlight regression, click OK. You then need to assign input X and Y ranges. A new sheet will report the ANOVA table. Read significance F, and see whether the F value is greater than 0.05 ). 2. The following table shows the elevation range for the northern Willamette Valley with the fraction of total area for each elevation increment. (a) Using the regression equation developed in question 1, estimate the precipitation amount for each elevation increment. (Hint: Use the mid-point of each elevation increment as your explanatory variable) (b) What is the area-weighted precipitation amount for each elevation increment? (Hint: Calculate the areaweighted precipitation amount for each elevation increment by multiolving the area fraction by precipitation