

Answered step by step
Verified Expert Solution
Question
1 Approved Answer
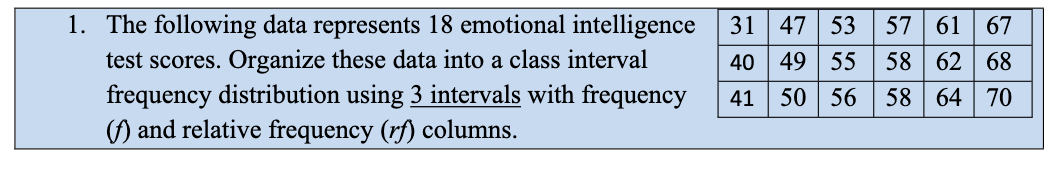
1. The following data represents 18 emotional intelligence 31 47 53 57 61 67 test scores. Organize these data into a class interval 40 49
Step by Step Solution
There are 3 Steps involved in it
Step: 1

Get Instant Access to Expert-Tailored Solutions
See step-by-step solutions with expert insights and AI powered tools for academic success
Step: 2

Step: 3
Ace Your Homework with AI
Get the answers you need in no time with our AI-driven, step-by-step assistance
Get Started
Square Summable Power Series
Authors: Louis De Branges, James Rovnyak
1st Edition
0486801365, 9780486801360