Answered step by step
Verified Expert Solution
Link Copied!

Question

1 Approved Answer

1. The following diagrams show the initial demand curve for cars, labelled D1_ In each of the diagrams, draw where appropriate, the new demand curve
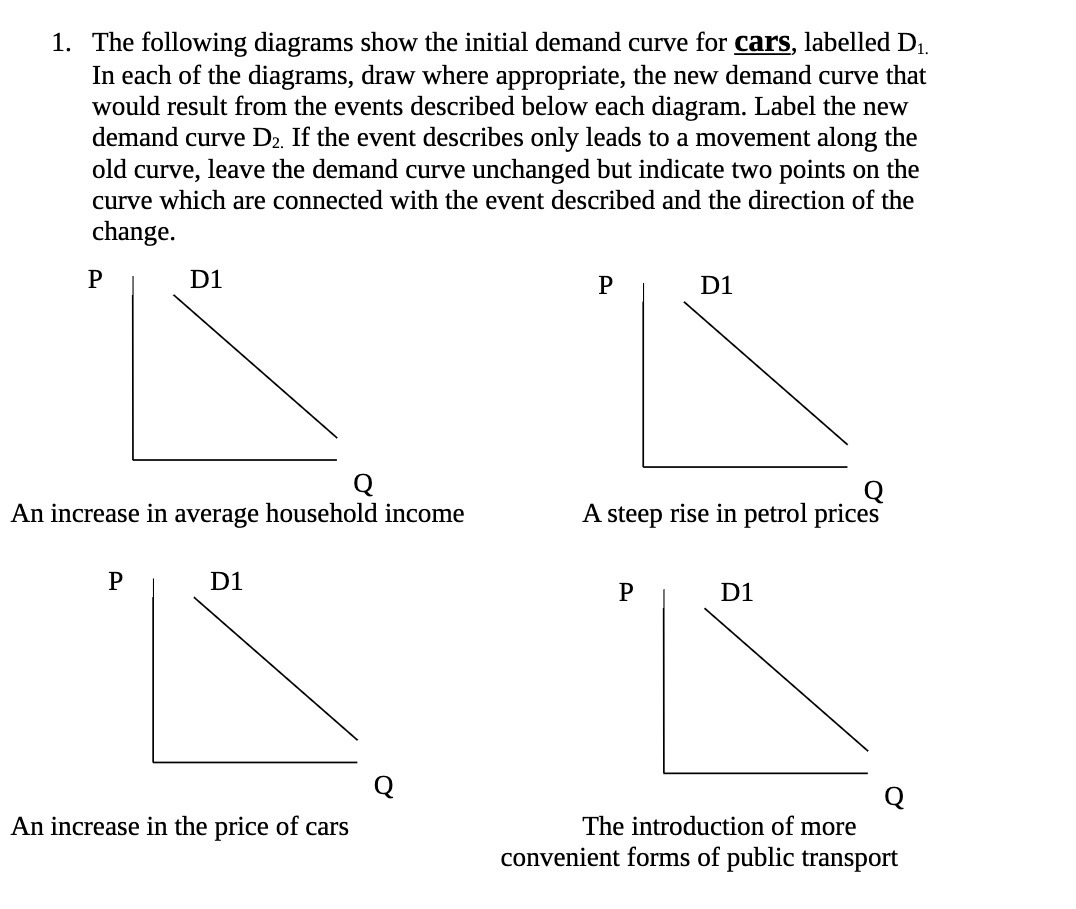
image text in transcribed
1. The following diagrams show the initial demand curve for cars, labelled D1_ In each of the diagrams, draw where appropriate, the new demand curve that would result from the events described below each diagram. Label the new demand curve D2. If the event describes only leads to a movement along the old curve, leave the demand curve unchanged but indicate two points on the curve which are connected with the event described and the direction of the change. P D1 p D1 Q Q An increase in average household income A steep rise in petrol prices P D1 P D1 Q Q An increase in the price of cars The introduction of more convenient forms of public transport

Step by Step Solution

There are 3 Steps involved in it

Step: 1

blur-text-image

Get Instant Access to Expert-Tailored Solutions

See step-by-step solutions with expert insights and AI powered tools for academic success

Step: 2

blur-text-image

Step: 3

blur-text-image

Ace Your Homework with AI

Get the answers you need in no time with our AI-driven, step-by-step assistance

Get Started

Recommended Textbook for

Macroeconomics Principles Applications And Tools

Authors: Arthur O Sullivan, Steven M. Sheffrin, Stephen J. Perez

7th Edition

978-0134089034, 9780134062754, 134089030, 134062752, 978-0132555234

More Books

Students also viewed these Economics questions