

Answered step by step
Verified Expert Solution
Question
1 Approved Answer
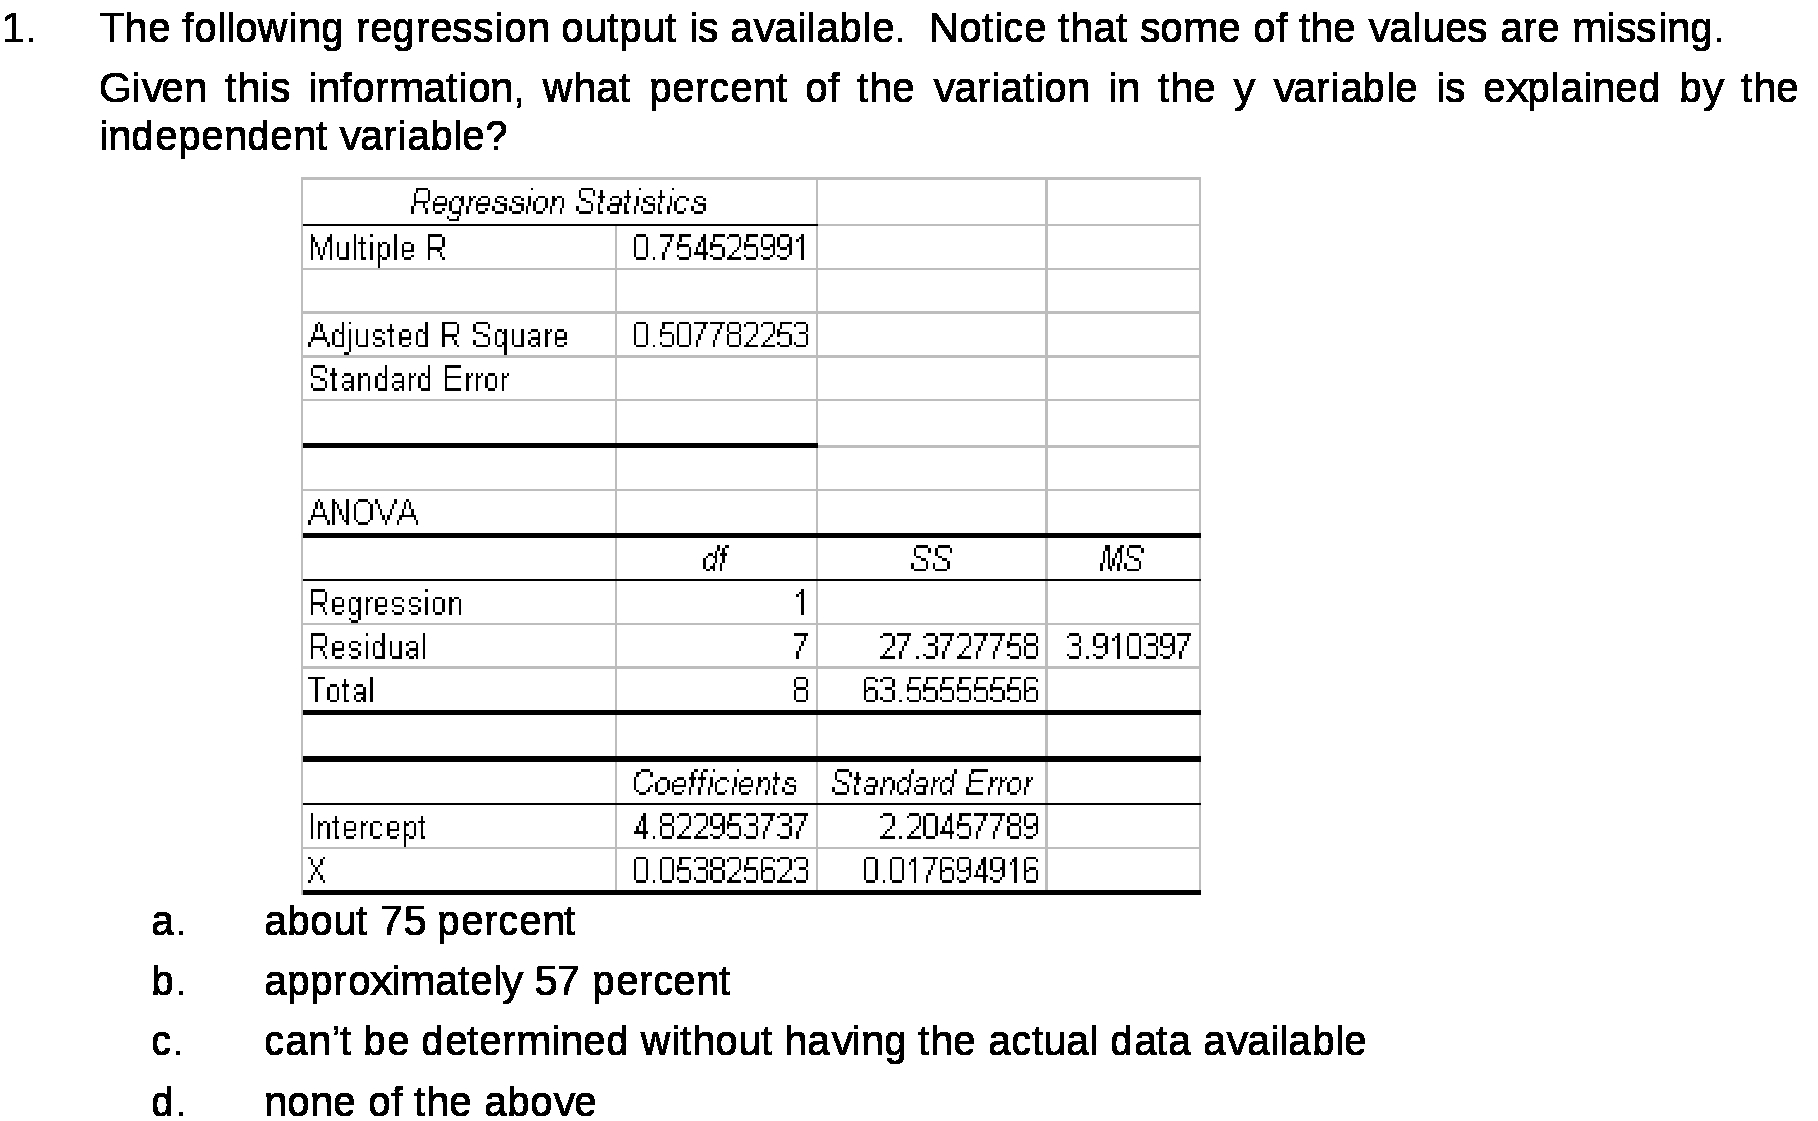
1. The following regression output is available. Notice that some of the values are missing. Given this information, what percent of the variation in the
Step by Step Solution
There are 3 Steps involved in it
Step: 1

Get Instant Access to Expert-Tailored Solutions
See step-by-step solutions with expert insights and AI powered tools for academic success
Step: 2

Step: 3
Ace Your Homework with AI
Get the answers you need in no time with our AI-driven, step-by-step assistance
Get Started
California Algebra 1 Concepts Skills And Problem Solving
Authors: Berchie Holliday, Gilbert J. Cuevas, Beatrice Luchin, John A. Carter, Daniel Marks
1st Edition
0078778522, 978-0078778520