

Answered step by step
Verified Expert Solution
Question
1 Approved Answer
1. The following table shows sample data for the number of motor registration and the number of tyres sold in a certain territory for the
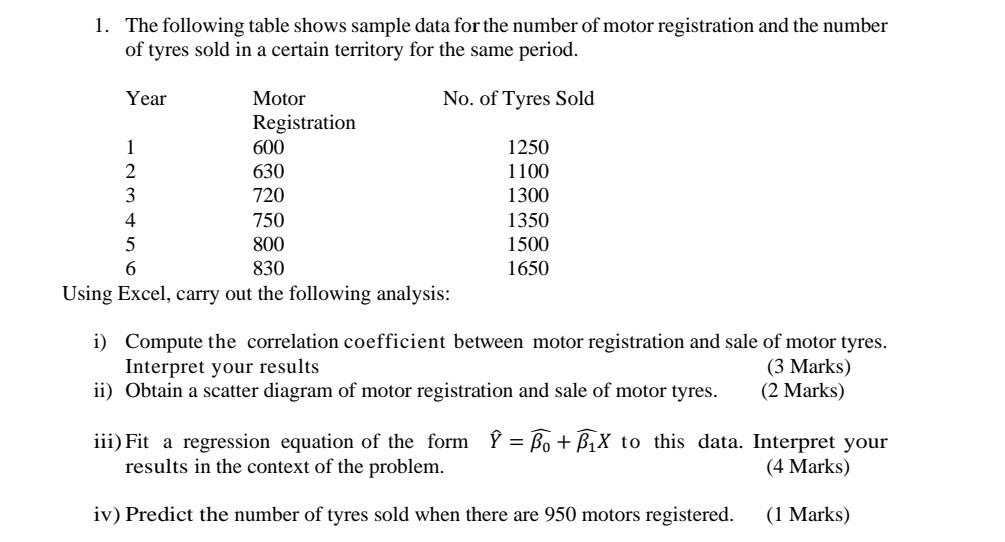
1. The following table shows sample data for the number of motor registration and the number of tyres sold in a certain territory for the same period. Year Motor No. of Tyres Sold Registration 1 600 1250 2 630 1100 3 720 1300 4 750 1350 5 800 1500 6 830 1650 Using Excel, carry out the following analysis: i) Compute the correlation coefficient between motor registration and sale of motor tyres. Interpret your results (3 Marks) (2 Marks) ii) Obtain a scatter diagram of motor registration and sale of motor tyres. iii) Fit a regression equation of the form = Bo + X to this data. results in the context of the problem. Interpret your (4 Marks) iv) Predict the number of tyres sold when there are 950 motors registered. (1 Marks)
Step by Step Solution
There are 3 Steps involved in it
Step: 1

Get Instant Access to Expert-Tailored Solutions
See step-by-step solutions with expert insights and AI powered tools for academic success
Step: 2

Step: 3
Ace Your Homework with AI
Get the answers you need in no time with our AI-driven, step-by-step assistance
Get Started
The Handbook Of Professionally Managed Assets A Definitive Guide To Profiting From Alternative Investments
Authors: Keith Fevurly
1st Edition
143026019X, 978-1430260196