Question
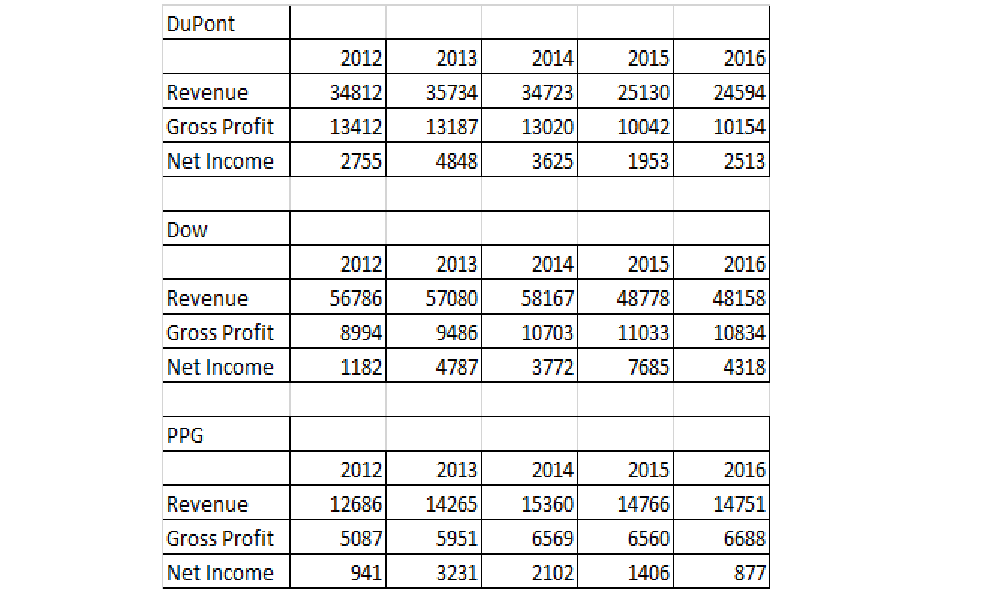
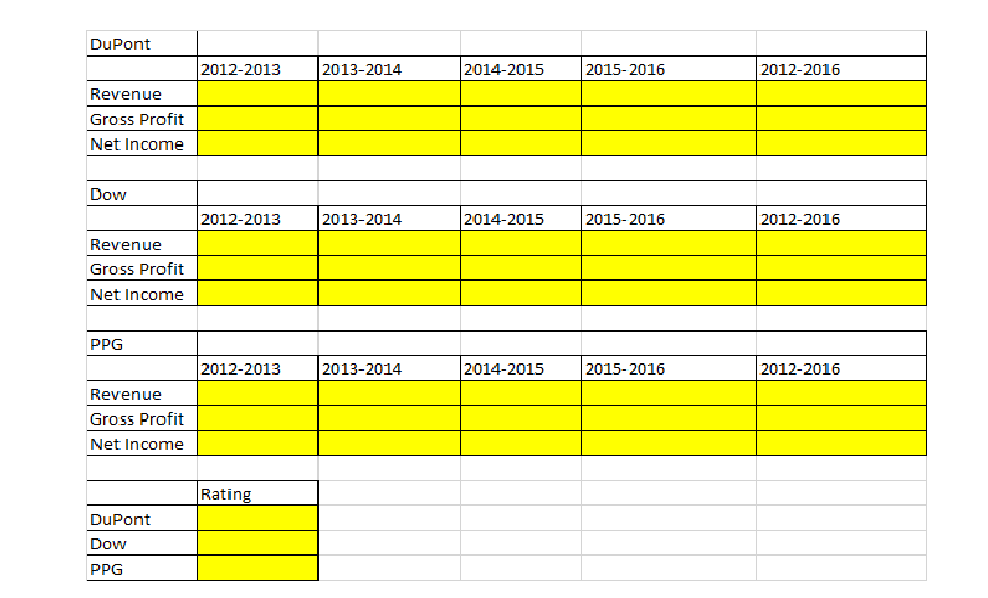
1. The following tables show the three chemical companies' performance numbers for the last five years. Calculate the annual growth percentages for these chemical companies
1. The following tables show the three chemical companies' performance numbers for the last five years.
Calculate the annual growth percentages for these chemical companies and rate from 1 (poor) to 10 (excellent).
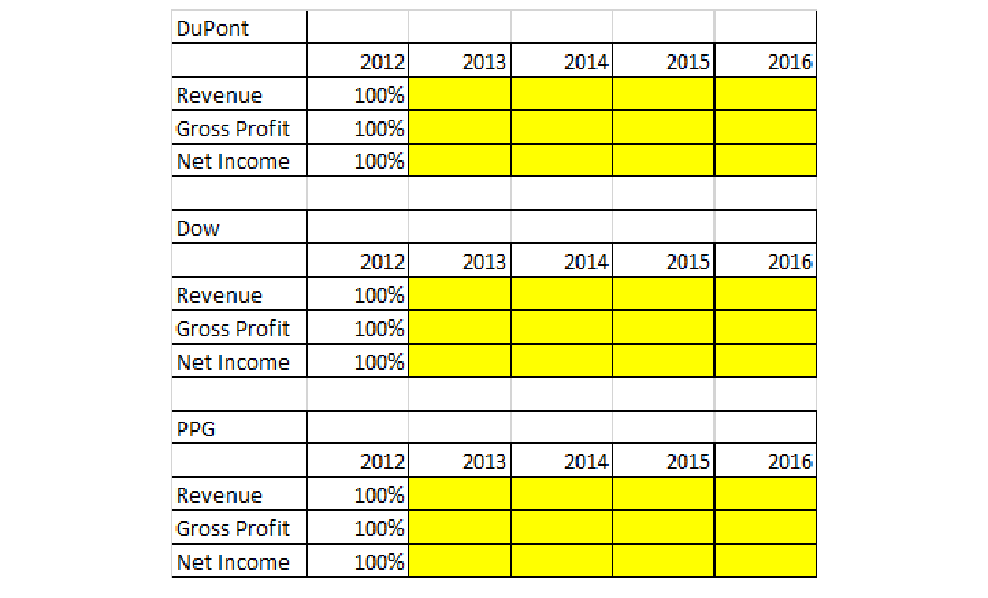
2. An alternative to growth percentages is to set the earliest year as the base year = 100 and calculate the remaining years as percentages. For DuPont, 2012 is set to 100%.
Revenues for 2013 are calculated as (35734 / 34812). Complete the following tables, analyze the trend data and compare it to the growth analysis in Question 1.
 3. The following performance information is available for the last five quarters for the three chemical companies (in millions). Complete the common-size and percentage change table.
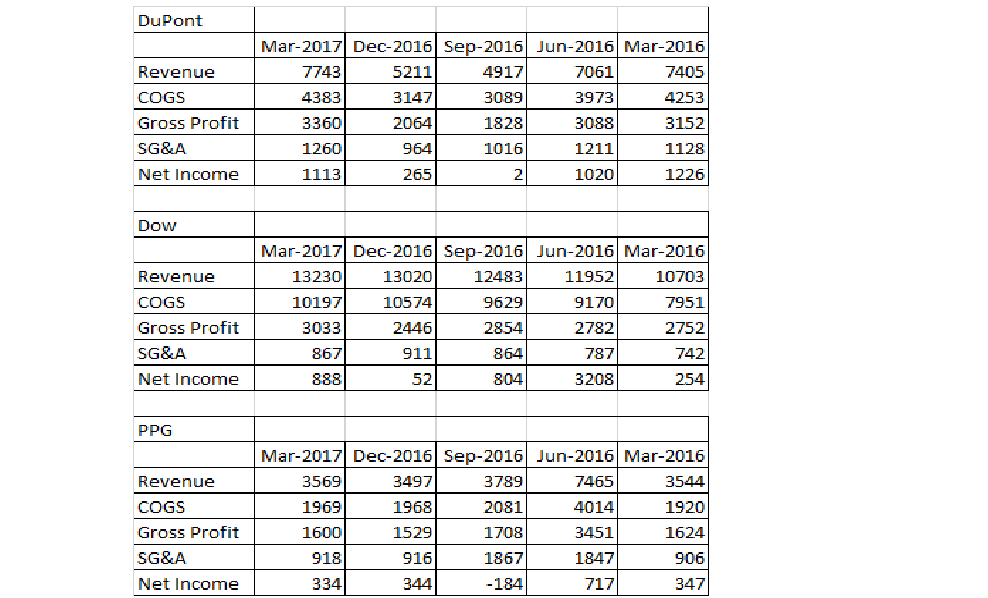
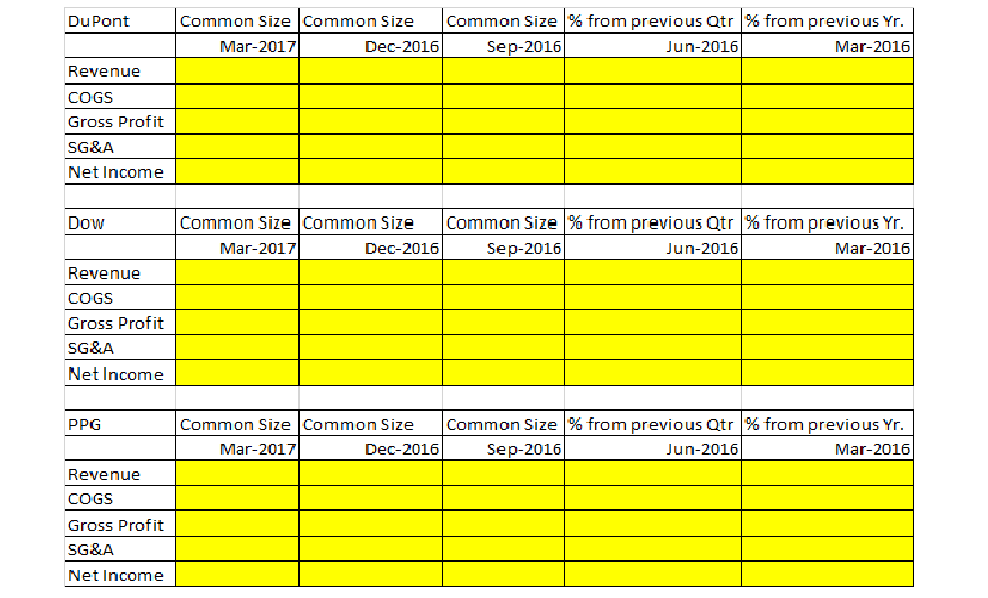 Does the quarterly analysis indicate any red flags? Explain
Step by Step Solution
There are 3 Steps involved in it
Step: 1

Get Instant Access to Expert-Tailored Solutions
See step-by-step solutions with expert insights and AI powered tools for academic success
Step: 2

Step: 3

Ace Your Homework with AI
Get the answers you need in no time with our AI-driven, step-by-step assistance
Get Started


