

Question
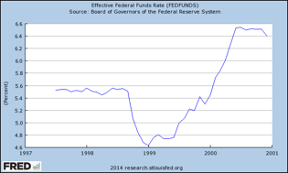
1) The graph below shows the federal funds rate for the US during the late 1990s and early 2000s. During this time, Argentina had pegged
1) The graph below shows the federal funds rate for the US during the late 1990s and early 2000s. During this time, Argentina had pegged their peso to the US dollar.
2. a) Referring to the graphic below, under what conditions does it make sense for countries to peg their currency to a base country. Be clear as to why the symmetry of shocks and economic integration are so important in any country's decision whether to peg or float. Please limit your discussion to the importance of the symmetry of shocks and economic integration, you will elaborate on other factors in a question below. Please use real world examples to buttress your arguments. After your discussion, identify by labeling as point A (on the graphic below) where you think Argentina and the US were in (in the late 1990s) terms of the graphic (below).
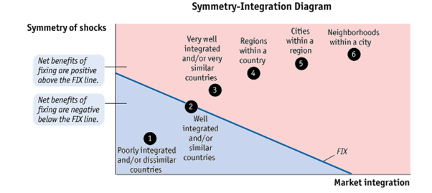
b) We now continue our discussion with other factors that influence a country's decision to fix or float. In particular, name and explain other factors (besides those discussed in part a) above) that would cause the benefits of fixing to exceed the costs of fixing. Please apply these to the case of the US and Argentina during this time period. When we include these other factors into our analysis, what happens to the "FIX" line above? Explain.
We now consider the Federal Reserve's behavior during the late 1990s. After the Russian financial crisis, the US economy was growing briskly with the economy experiencing positive IS shocks, similar to what happened, but for very different reasons, in Germany during their re-unification. As a result, the Federal Reserve was fearful of overheating and conducted contractionary monetary policy as shown in the graph of the federal funds rate above.
c) As best you can, explain the factors/influences that resulted in the IS curve for the US shifting out and to the right during this time.
d) Draw an IS - LM diagram depicting these developments for the US economy. In particular, start at an initial equilibrium (point A) and then depict the positive IS shocks along with the contractionary monetary policy and label as point B. Assume the Fed is successful in stabilizing output. Please be sure to completely label your diagram.
Effective Federal Funds Rate (PEOFUNDS) Source: Board of Gemers the Federal Reserve System 64 62 50 5.6 54 50 1917 1990 1999 2000 FRED 2014 researcher Symmetry-Integration Diagram Symmetry of shocks Regions within a country Cities within a region Neighborhoods within a city 6 Net benefits of facing are positive above the FIX line. Net benefits of facing are negative below the FIX Line. Very well integrated and/or very similar countries 3 Well integrated 1 and/or Poorly integrated similar and/or dissimilar countries countries FIX Market integration Effective Federal Funds Rate (PEOFUNDS) Source: Board of Gemers the Federal Reserve System 64 62 50 5.6 54 50 1917 1990 1999 2000 FRED 2014 researcher Symmetry-Integration Diagram Symmetry of shocks Regions within a country Cities within a region Neighborhoods within a city 6 Net benefits of facing are positive above the FIX line. Net benefits of facing are negative below the FIX Line. Very well integrated and/or very similar countries 3 Well integrated 1 and/or Poorly integrated similar and/or dissimilar countries countries FIX Market integrationStep by Step Solution
There are 3 Steps involved in it
Step: 1

Get Instant Access to Expert-Tailored Solutions
See step-by-step solutions with expert insights and AI powered tools for academic success
Step: 2

Step: 3
Ace Your Homework with AI
Get the answers you need in no time with our AI-driven, step-by-step assistance
Get Started
The Human Resource Function Audit
Authors: Peter Reilly, Marie Strebler, Polly Kettley
1st Edition
0955970776, 978-0955970771