1) The heights (in inches) of 20 randomly selected students were recorded below: 67, 63, 68, 68, 70, 62, 65, 64, 68, 65, 60, 64,
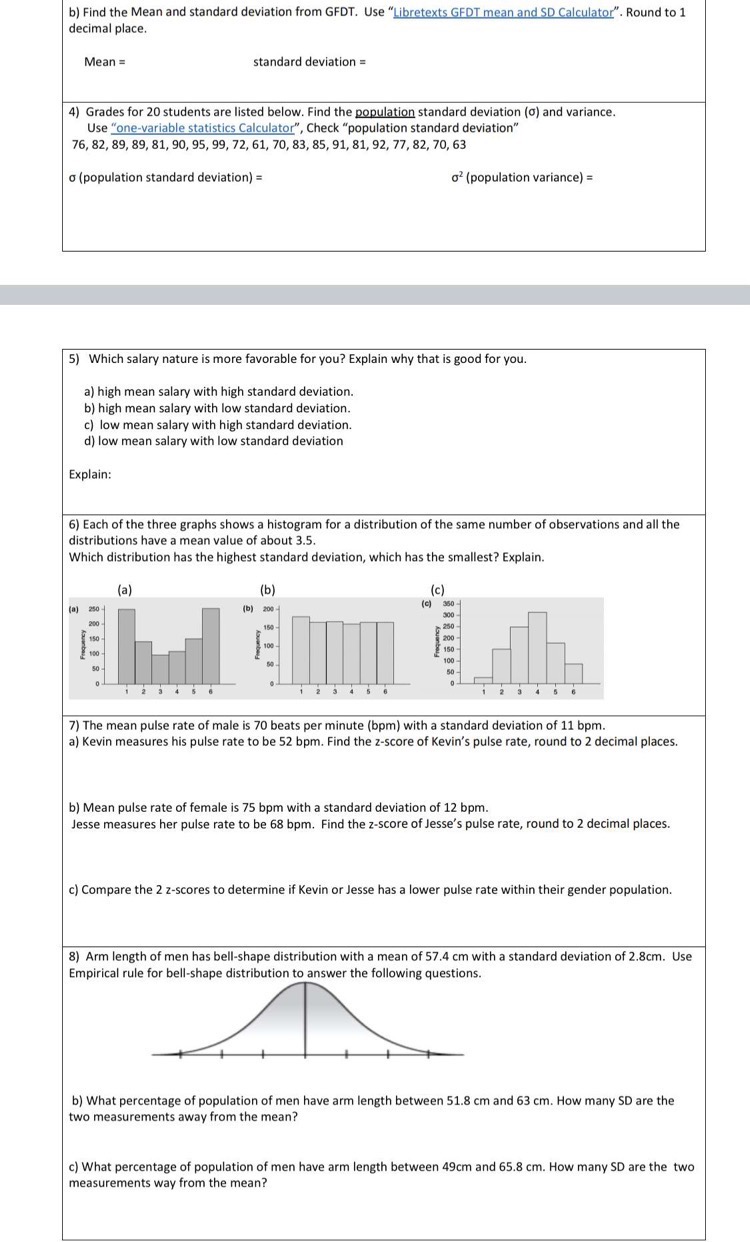
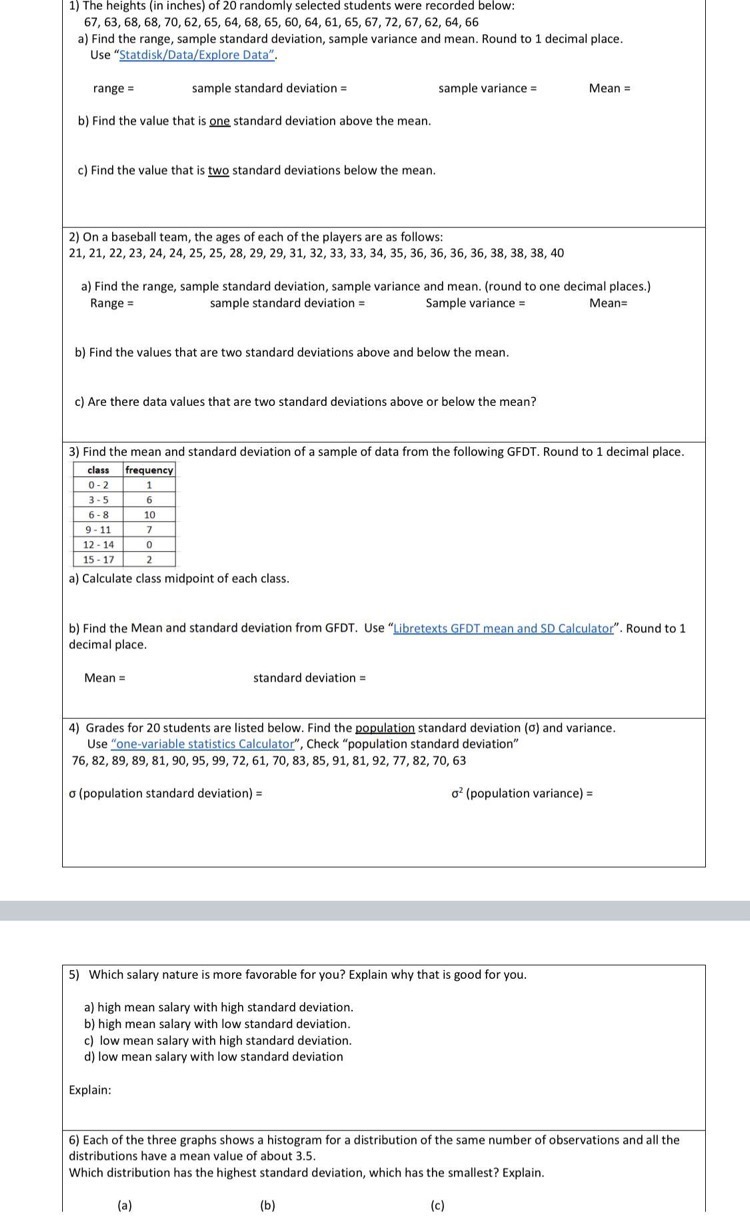
1) The heights (in inches) of 20 randomly selected students were recorded below: 67, 63, 68, 68, 70, 62, 65, 64, 68, 65, 60, 64, 61, 65, 67, 72, 67, 62, 64, 66 a) Find the range, sample standard deviation, sample variance and mean. Round to 1 decimal place. Use "Statdisk/Data/Explore Data". range = sample standard deviation = sample variance = Mean = b) Find the value that is one standard deviation above the mean. c) Find the value that is two standard deviations below the mean. 2) On a baseball team, the ages of each of the players are as follows: 21, 21, 22, 23, 24, 24, 25, 25, 28, 29, 29, 31, 32, 33, 33, 34, 35, 36, 36, 36, 36, 38, 38, 38, 40 a) Find the range, sample standard deviation, sample variance and mean. (round to one decimal places.) Range = sample standard deviation = Sample variance = Mean= b) Find the values that are two standard deviations above and below the mean. c) Are there data values that are two standard deviations above or below the mean? 3) Find the mean and standard deviation of a sample of data from the following GFDT. Round to 1 decimal place. class frequency 0-2 3-5 6 6-8 10 9 - 11 12 - 14 15 - 17 a) Calculate class midpoint of each class. b) Find the Mean and standard deviation from GFDT. Use "Libretexts GFDT mean and SD Calculator". Round to 1 decimal place. Mean = standard deviation = 4) Grades for 20 students are listed below. Find the population standard deviation (o) and variance. Use "one-variable statistics Calculator", Check "population standard deviation" 76, 82, 89, 89, 81, 90, 95, 99, 72, 61, 70, 83, 85, 91, 81, 92, 77, 82, 70, 63 o (population standard deviation) = o' (population variance) = 5) Which salary nature is more favorable for you? Explain why that is good for you. a) high mean salary with high standard deviation. b) high mean salary with low standard deviation. c) low mean salary with high standard deviation. d) low mean salary with low standard deviation Explain: 6) Each of the three graphs shows a histogram for a distribution of the same number of observations and all the distributions have a mean value of about 3.5. Which distribution has the highest standard deviation, which has the smallest? Explain. (a) (b ) (c)b) Find the Mean and standard deviation from GFDT. Use "Libretexts GFDT mean and SD Calculator". Round to 1 decimal place. Mean = standard deviation = 4) Grades for 20 students are listed below. Find the population standard deviation (o) and variance. Use "one-variable statistics Calculator", Check "population standard deviation" 76, 82, 89, 89, 81, 90, 95, 99, 72, 61, 70, 83, 85, 91, 81, 92, 77, 82, 70, 63 o (population standard deviation) = o' (population variance) = 5) Which salary nature is more favorable for you? Explain why that is good for you. a) high mean salary with high standard deviation. b) high mean salary with low standard deviation. c) low mean salary with high standard deviation. d) low mean salary with low standard deviation Explain: 6) Each of the three graphs shows a histogram for a distribution of the same number of observations and all the distributions have a mean value of about 3.5. Which distribution has the highest standard deviation, which has the smallest? Explain. (a) (b) (c) (a) 250 360 7) The mean pulse rate of male is 70 beats per minute (bom) with a standard deviation of 11 bpm. a) Kevin measures his pulse rate to be 52 bom. Find the z-score of Kevin's pulse rate, round to 2 decimal places. b) Mean pulse rate of female is 75 bom with a standard deviation of 12 bpm. Jesse measures her pulse rate to be 68 bom. Find the z-score of Jesse's pulse rate, round to 2 decimal places. c) Compare the 2 z-scores to determine if Kevin or Jesse has a lower pulse rate within their gender population. 8) Arm length of men has bell-shape distribution with a mean of 57.4 cm with a standard deviation of 2.8cm. Use Empirical rule for bell-shape distribution to answer the following questions. b) What percentage of population of men have arm length between 51.8 cm and 63 cm. How many SD are the two measurements away from the mean? c) What percentage of population of men have arm length between 49cm and 65.8 cm. How many SD are the two measurements way from the mean
Step by Step Solution
There are 3 Steps involved in it
Step: 1
Get Instant Access to Expert-Tailored Solutions
See step-by-step solutions with expert insights and AI powered tools for academic success
Step: 2
Step: 3
Ace Your Homework with AI
Get the answers you need in no time with our AI-driven, step-by-step assistance