Answered step by step
Verified Expert Solution
Link Copied!

Question

1 Approved Answer

1. The histogram shown summarizes the responses of 100 people when asked, What was the price of the last meal you purchased? Based on the
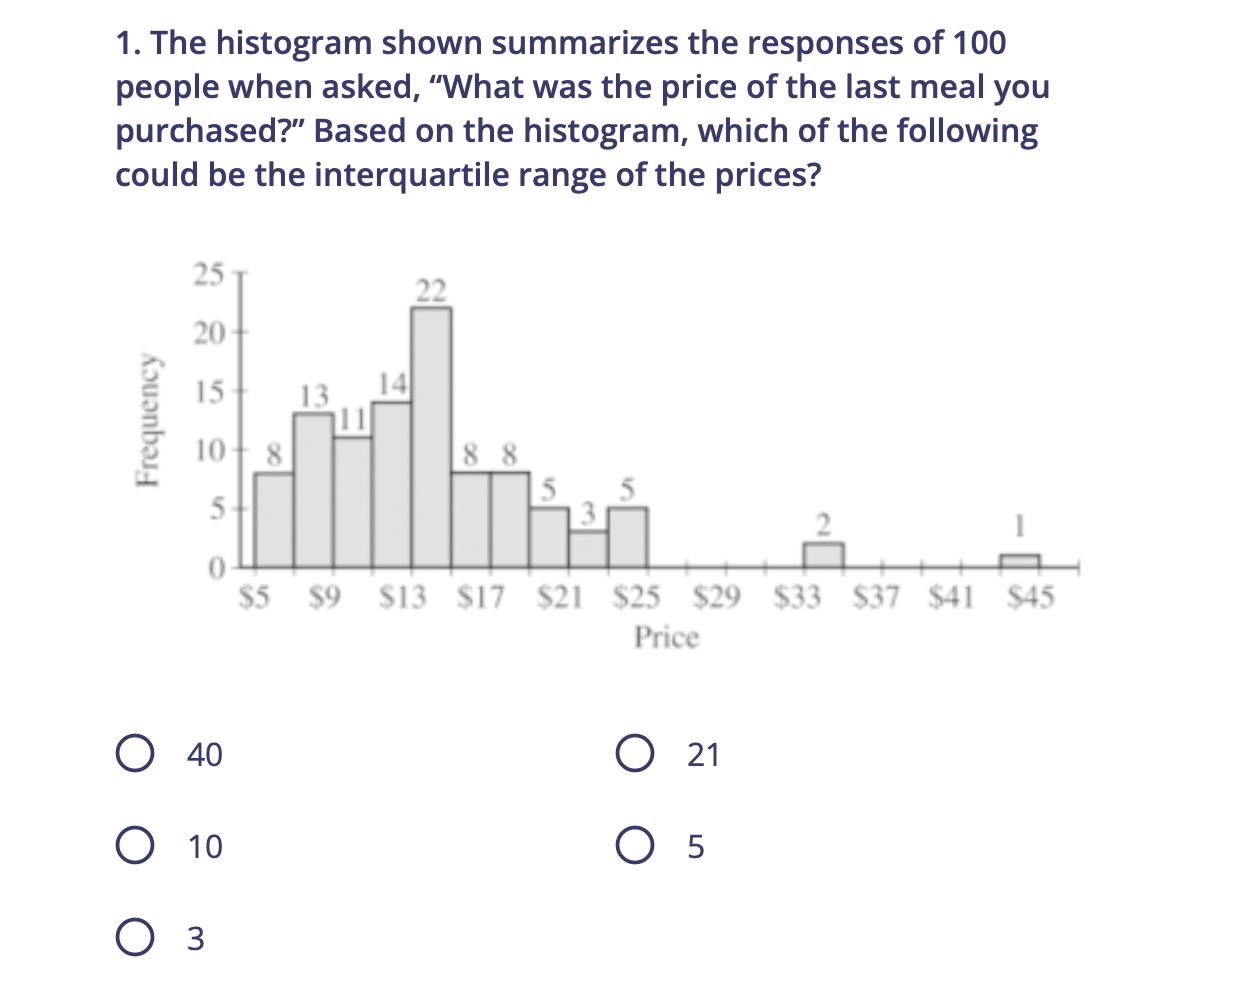
image text in transcribed
1. The histogram shown summarizes the responses of 100 people when asked, "What was the price of the last meal you purchased?" Based on the histogram, which of the following could be the interquartile range of the prices? 25 22 20 15 13 14 Frequency 10 8 8 8 5 5 $5 $9 $13 $17 $21 $25 $29 $33 $37 $41 $45 Price O 40 O 21 O 10 0 5 O 3

Step by Step Solution

There are 3 Steps involved in it

Step: 1

blur-text-image

Get Instant Access to Expert-Tailored Solutions

See step-by-step solutions with expert insights and AI powered tools for academic success

Step: 2

blur-text-image

Step: 3

blur-text-image

Ace Your Homework with AI

Get the answers you need in no time with our AI-driven, step-by-step assistance

Get Started

Recommended Textbook for

An Introduction to the Mathematics of financial Derivatives

Authors: Salih N. Neftci

2nd Edition

978-0125153928, 9780080478647, 125153929, 978-0123846822

More Books

Students also viewed these Mathematics questions

Question

LO6.1 Discuss price elasticity of demand and how it is calculated.

Answered: 1 week ago