

Answered step by step
Verified Expert Solution
Question
1 Approved Answer
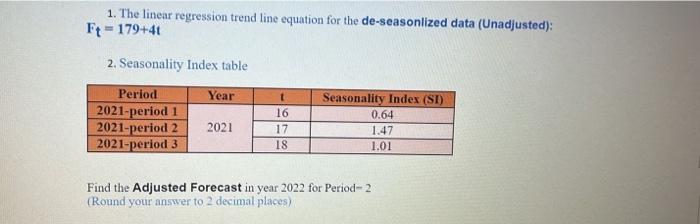
1. The linear regression trend line equation for the de-seasonlized data (Unadjusted): Ft = 179+4t 2. Seasonality Index table Period Year t Seasonality Index (SI)
Step by Step Solution
There are 3 Steps involved in it
Step: 1

Get Instant Access to Expert-Tailored Solutions
See step-by-step solutions with expert insights and AI powered tools for academic success
Step: 2

Step: 3
Ace Your Homework with AI
Get the answers you need in no time with our AI-driven, step-by-step assistance
Get Started
Invested How I Learned To Master My Mind My Fears And My Money To Achieve Financial Freedom And Life With A Little Help From Warren Buffett, Charlie Munger, And My Dad
Authors: Danielle Town, Phil Town
1st Edition
0062672649,0062672673