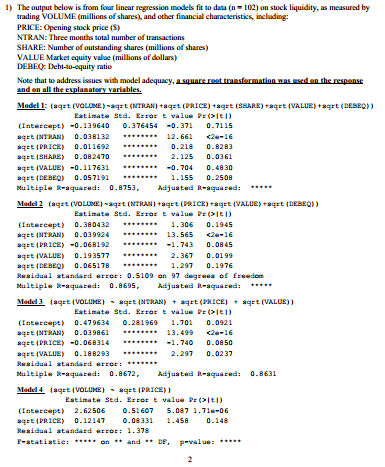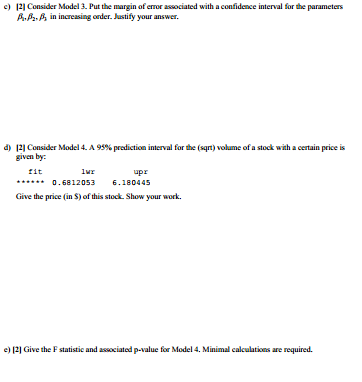

1) The output below is from four linear regression models fit to data (n = 102) on stock liquidity, as measured by trading VOLUME (millions of shares), and other financial characteristics, including: PRICE: Opening stock price (s) NTRAN: Three months total number of transactions SHARE: Number of outstanding shares (millions of shares) VALUE Market cquity value (millions of dollars) DEBEO: Debt-to-equity ratio Note that to address issues with model adequacy, a square rost transformation was used on the response and on all the explanatory variables. Model 1: (aqrt (VOLUME) 323 (NTBLAN) taqrt(RICE) tart (SHARE)+sqrt {VALUE) taqrt (DEBEO)) Estimate Std. Brrort value DE (1) (Intercept) -0.139640 0.376454 -0.371 0.7115 SE INTRAN) 0.038132 ******** 12.661 (2-16 sqrt(PRICE) 0.011692 0.218 0.8283 sqrt (SHARE) 0.082470 2.125 0.0361 sqrt(VALUE) -0.117631 -0.704 0.4830 sqrt (DEBEQ) 0.05 7191 1.155 0.2508 Multiple k-aquared: 0.8753, Adjusted Reaquared: Model 2 (aqet (VOLUME) -29= (NTRAN) Taqrt (PRICE) art (VALUE) *sqrt (DEBEQ)) Estimate Std. Errort value Dr(>11) (Intercept) 0.380432 1.306 0.1945 sqrt INTRAN) 0.039924 13.5652-16 sqrt(PRICE) -0.068192 -1.743 0.0845 sqrt(VALUE) 0.193577 2.367 0.0199 sqrt (DEBEO) 0.065178 1.297 0.1976 Residual standard error: 0.5109 on 97 degrees of freedom Multiple R-squared: 0.8695, Adjusted B-squaredi **** Model 3 art (VOLUME) sqrt {NTRAN) + (PRICE) + aqrt (VALUE)) Estimate Std. Errort value DE (1) (Intercept) 0.479634 0.281969 1.701 0.0921 sqrt(NTRAN) 0.039861 13.499 (2-16 sqrt (PRICE) -0.068314 -1.740 0.0850 sqrt(VALUE) 0.188293 2.297 0.0237 Residual standard SEFE! Multiple k-squared: 0.8672, Adjuated R-aquared: 0.8631 Model 4 aqrt VOLUME) SEE (PRICE) Estimate Std. Revort value PE (11) (Intercept) 2.62506 0.51607 5.087 1.71-06 sqrt {PRICE) 0.12147 0.08331 1.458 0.148 Residual standard error: 1.378 F-statistie: *****on** and DF, p-value: ***** 2 1) The output below is from four linear regression models fit to data (n = 102) on stock liquidity, as measured by trading VOLUME (millions of shares), and other financial characteristics, including: PRICE: Opening stock price (s) NTRAN: Three months total number of transactions SHARE: Number of outstanding shares (millions of shares) VALUE Market cquity value (millions of dollars) DEBEO: Debt-to-equity ratio Note that to address issues with model adequacy, a square rost transformation was used on the response and on all the explanatory variables. Model 1: (aqrt (VOLUME) 323 (NTBLAN) taqrt(RICE) tart (SHARE)+sqrt {VALUE) taqrt (DEBEO)) Estimate Std. Brrort value DE (1) (Intercept) -0.139640 0.376454 -0.371 0.7115 SE INTRAN) 0.038132 ******** 12.661 (2-16 sqrt(PRICE) 0.011692 0.218 0.8283 sqrt (SHARE) 0.082470 2.125 0.0361 sqrt(VALUE) -0.117631 -0.704 0.4830 sqrt (DEBEQ) 0.05 7191 1.155 0.2508 Multiple k-aquared: 0.8753, Adjusted Reaquared: Model 2 (aqet (VOLUME) -29= (NTRAN) Taqrt (PRICE) art (VALUE) *sqrt (DEBEQ)) Estimate Std. Errort value Dr(>11) (Intercept) 0.380432 1.306 0.1945 sqrt INTRAN) 0.039924 13.5652-16 sqrt(PRICE) -0.068192 -1.743 0.0845 sqrt(VALUE) 0.193577 2.367 0.0199 sqrt (DEBEO) 0.065178 1.297 0.1976 Residual standard error: 0.5109 on 97 degrees of freedom Multiple R-squared: 0.8695, Adjusted B-squaredi **** Model 3 art (VOLUME) sqrt {NTRAN) + (PRICE) + aqrt (VALUE)) Estimate Std. Errort value DE (1) (Intercept) 0.479634 0.281969 1.701 0.0921 sqrt(NTRAN) 0.039861 13.499 (2-16 sqrt (PRICE) -0.068314 -1.740 0.0850 sqrt(VALUE) 0.188293 2.297 0.0237 Residual standard SEFE! Multiple k-squared: 0.8672, Adjuated R-aquared: 0.8631 Model 4 aqrt VOLUME) SEE (PRICE) Estimate Std. Revort value PE (11) (Intercept) 2.62506 0.51607 5.087 1.71-06 sqrt {PRICE) 0.12147 0.08331 1.458 0.148 Residual standard error: 1.378 F-statistie: *****on** and DF, p-value: ***** 2


