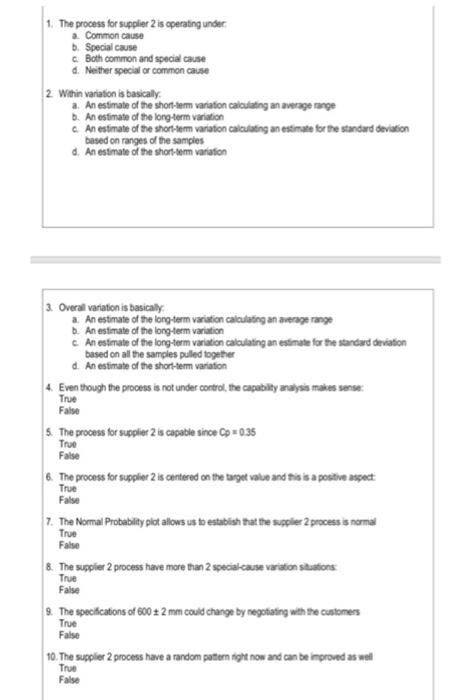
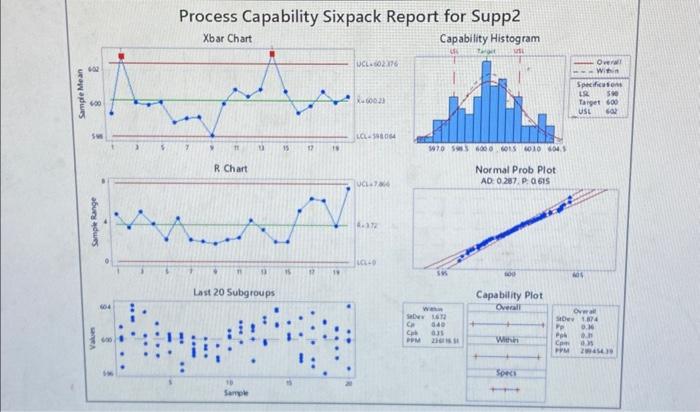
1. The process for supplier 2 is aperating under: a. Common caise b. Special cause c. Both common and special cause d. Neither special or common cause 2. Within variation is basically. a. An estimate of the shon-term variation caloulating an average range b. An esfimate of the longterm variation c. An estimate of the shortiem varaton calculating an estimate for the standard deviation based on ranges of the samples d. An estmate of the shorthem variafion 3. Overall variation is basicaly a. An estimate of the longterm variation caloulating an average range b. An estimate of the long-term variation c. An estmate of the long-erm variation calculating an esimate for the standard drvation based on all the samples puled together d. An estimate of the short-term variation 4. Even though the process is not under cortrol, the cagablity analysis mabes sense: True False 5. The process for supplier 2 is capable since C=0.35 True False 6. The process for supplior 2 is centered on the target value and this is a postive aspect True False 7. The Normal Probability plot allows us to establish that the sugpler 2 process is normal True False 8. The sugpler 2 process have more than 2 speciak-cause variation sitations: True False 9. The specifcations of 6002 mm could change by negotiating wth the customers True False 10. The suppler 2 process have a random potern hight now and can be improved as well True False Process Capability Sixpack Report for Supp2 Last 20 Subgroups Capability Plot 1. The process for supplier 2 is aperating under: a. Common caise b. Special cause c. Both common and special cause d. Neither special or common cause 2. Within variation is basically. a. An estimate of the shon-term variation caloulating an average range b. An esfimate of the longterm variation c. An estimate of the shortiem varaton calculating an estimate for the standard deviation based on ranges of the samples d. An estmate of the shorthem variafion 3. Overall variation is basicaly a. An estimate of the longterm variation caloulating an average range b. An estimate of the long-term variation c. An estmate of the long-erm variation calculating an esimate for the standard drvation based on all the samples puled together d. An estimate of the short-term variation 4. Even though the process is not under cortrol, the cagablity analysis mabes sense: True False 5. The process for supplier 2 is capable since C=0.35 True False 6. The process for supplior 2 is centered on the target value and this is a postive aspect True False 7. The Normal Probability plot allows us to establish that the sugpler 2 process is normal True False 8. The sugpler 2 process have more than 2 speciak-cause variation sitations: True False 9. The specifcations of 6002 mm could change by negotiating wth the customers True False 10. The suppler 2 process have a random potern hight now and can be improved as well True False Process Capability Sixpack Report for Supp2 Last 20 Subgroups Capability Plot